


Global Convergence May Be a Win-Win for Stock Investors
With international and U.S. stocks on the rise, portfolios with exposure to both could benefit.
by Jurrien Timmer | Director of Global Macro | @TimmerFidelity | Fidelity Investments Canada
MARCH 2017
Key Takeaways
• U.S. stocks are in a much-publicized and broad-based rally, but there’s a compelling global rally under way as well.
• Since this time last year, the global economy has been converging in a worldwide, synchronized upturn.
• International stocks have attractively low valuations and their earnings are recovering as much as (if not more than) U.S. earnings.
• With the rally in the U.S. dollar possibly running out of steam, a globally diversified portfolio may make more sense than ever. It’s been three months since the election and four weeks since the inauguration, but the onslaught of headlines and tape bombs from and about the new administration has been relentless. Not a day goes by, it seems, without another newsworthy development, be it positive or negative.
Investors and the media remain focused on whether, when, and how the Trump administration’s proposed legislative changes will impact stocks, interest rates, and the U.S. dollar. It seems the stock market’s every little move is attributed to something that is (or is not) happening in Washington. The Dow Jones Industrial Average’s recent move above 20,000 was a headline grabber given the recent unleashing of “animal spirits” in Corporate America.
The domestically oriented focus has certainly been warranted, considering the seismic regime shift that began last November. But another compelling story is also unfolding: a meaningful and synchronized upturn in the global economic cycle. The global economy has been recovering for about a year now, ever since the U.S. central bank backed off from its more hawkish path in early 2016 (which paved the way toward an easing of financial conditions) and China started reflating its economy again. These two developments—along with the recovery in oil prices—seem largely responsible for ending the global trade recession that had been in place since 2014.
This global recovery is significant because after several years of deviation, the international cycle is finally converging on the U.S. cycle. As a result, the global business cycle is in a synchronized upturn for the first time since 2011.
Back in the mid-2000s, the worldwide economy was highly synchronized because globalization was the major theme for investors. It became even more synchronized as global markets fell in tandem during the 2008 financial crisis, and remained equally synchronized during the recovery in 2009 following a coordinated global monetary and fiscal policy response. But beginning in late 2010/early 2011, the global cycle started to diverge. It began with China, when its government tightened policy in response to an overheating economy. That led to a multiyear slowdown in China, taking the rest of the emerging markets with it. As a result, the MSCI Emerging Markets Index has underperformed the S&P 500 Index since 2010.
Around that same time, the first rumblings occurred of what was to become the eurozone debt crisis. That caused a painful negative spiral for the eurozone economy and markets. Japan was also weak around that time, especially following the 2011 earthquake and tsunami. In other words, while the U.S. remained in a slow but stable mid-cycle expansion, the rest of the world was hit with a series of air pockets and speed bumps, which desynchronized the global business cycle.
The trouble accelerated in mid-2014 when the U.S. Federal Reserve (Fed) was in the beginning stages of its tightening campaign while the rest of the world remained in an easing mode. That led to a sharp rise in the U.S. dollar and a tightening of financial conditions, around the same time that oil prices collapsed and credit spreads widened. While the U.S. was able to endure these headwinds (despite a recession in the energy sector and parts of the industrials sectors), the rest of the world was hit hard, requiring ever more monetary and fiscal policy responses. For China, it meant capital flight and a depreciating currency.
Then about a year ago, following a 14% decline in the S&P 500 and much bigger declines elsewhere, the Fed responded to the soaring U.S. dollar and tightening financial conditions by significantly backpedaling on its forward guidance of four hikes in 2016 and four more in 2017. The results were dramatic: the dollar stopped rallying, financial conditions began to ease, oil prices recovered, and credit spreads narrowed.
At the same time, it became evident that the Chinese government was abandoning its austerity-and-reform agenda and going back to the credit well. In Q1 of 2016, about $1 trillion of new credit was unleashed in addition to an ongoing currency devaluation, fiscal stimulus in the form of deficit spending, and even monetary stimulus wherein the state-controlled banks were receiving liquidity from the People’s Bank of China. It has been a trifecta of monetary/fiscal/currency policy. Whether that policy is sustainable remains to be seen, but for now, at least, it seems to be working in reflating the Chinese economy and in providing a powerful tailwind for other emerging markets.
Why is all this important for the typical investor? Because it’s no longer just a U.S.-led market. There’s now an underlying global tailwind supporting equities in the form of a global earnings recovery and attractive valuations.
This may suggest that the U.S. stock market is less vulnerable to a possible disappointment on the fiscal policy front than many people fear, and that the global stock market is finally getting a more solid foundation.
To demonstrate how much the global environment has improved over the past year, consider Exhibit 1 below, which illustrates the risk-return curve of the world’s major equity markets. From May 2011 until February 2016, the U.S. was firmly in the lead and the risk-return curve for many non-U.S. markets was negative. Over the past year, however, much has changed: The U.S. is no longer first and the risk-return curve is positive for almost all international markets. Is this the start of a mean reversion away from U.S. market leadership in favor of international equities? Time will tell.
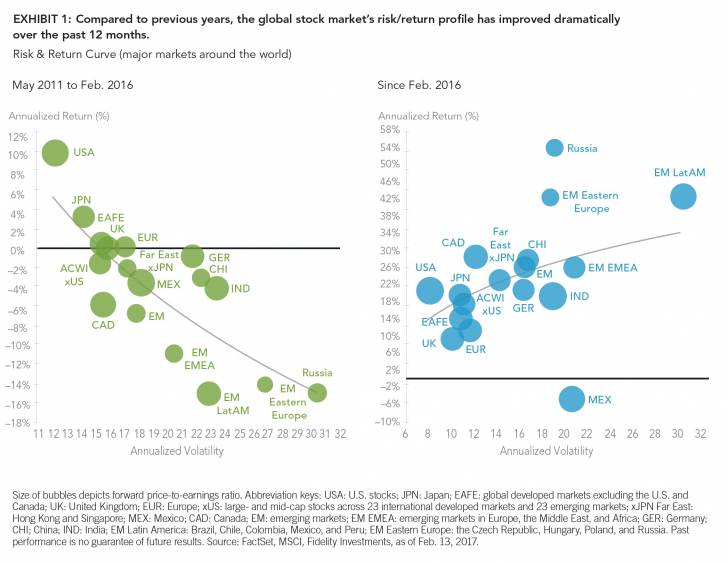
Currently, the U.S. stock market has the highest valuation (17x earnings on a forward earnings basis) among the developed world, and so far that has been justified. However, with policy uncertainty and inflation on the rise, many believe U.S. stocks are fully priced and that prices may underperform earnings for a while (it’s been just the opposite since March 2009).
Compared to forward earnings of 17x for the United States, international developed markets in aggregate are trading at 14x, Japan is at 14.5x, Germany is at 13.6x, and emerging markets are trading at only 12x. The emerging- market asset class looks especially inexpensive relative to the U.S., although it has been cheap for a reason. Until now, the U.S. has been the place to invest, and it is priced accordingly. But now, with earnings inflecting higher across the globe, that valuation differential starts to matter. So maybe it’s time to cast a wider net and go global.
Will the worst be first in 2017?
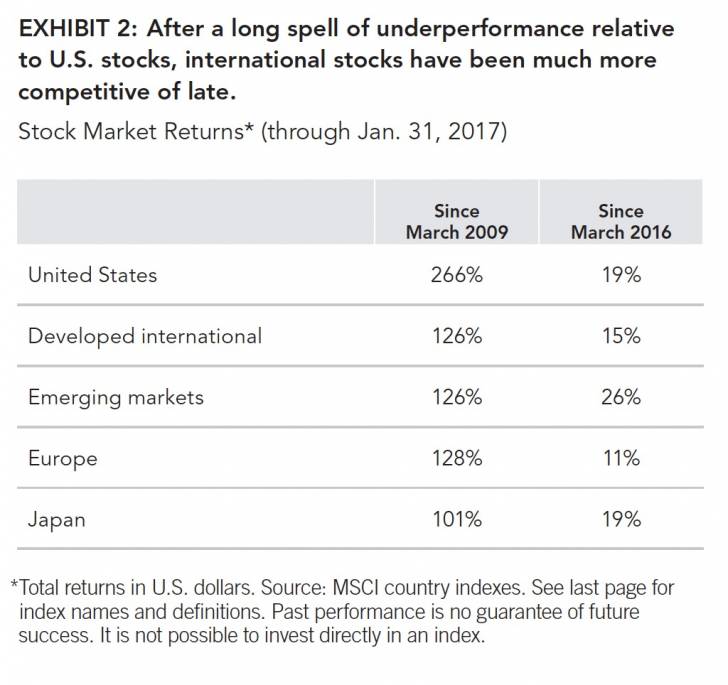
Since the end of the financial crisis in March 2009 through the end of January 2017, U.S. equities gained 266%, significantly outperforming most other global benchmarks (see Exhibit 2). But since the global convergence started a year ago, the U.S. is up 19%, the World ex-U.S. is up 18%, EAFE is up 15%, EM is up 26%, Japan is up 19%, and Europe is up 11%. Now, there is a much more uniform distribution of returns, and I expect it to continue for as long as this global synchronization continues.
The one region that has continued to lag since the global convergence began is Europe. This is not a surprise; Europe is still dealing with the aftermath of its debt crisis (Europe’s cycle is a few years behind the U.S. and therefore is still in healing mode). Brexit also took a toll, and now important elections (the Netherlands, France, Germany) are being held throughout 2017, which adds more uncertainty to the mix. Nevertheless, if Europe can weather its political storms and keep the euro together, it could be the sleeper hit of 2017.
Interestingly, while U.S. stocks have trounced Europe since the convergence started a year ago, Europe is slightly outperforming the U.S. on the earnings front (12-month forward EPS estimates are 8.5%, compared with 8.1% for the United States). Stock prices historically follow earnings, so better days may be ahead for European equities.
Investment implications
The key takeaway for investors is that we seemingly are no longer in the desynchronized regime that lasted from
May 2011 to February 2016. That period saw the U.S. justifiably outperform the rest of the world by a wide margin, while earning a higher P/E ratio as a result. But now we are in a different regime, one in which earnings in many global markets are recovering as much as (if not more than) U.S. earnings. When you combine this with the more compelling valuations for international stocks and a potentially peaking U.S. dollar, it makes for the strongest argument in years for “going global.” As such, now may be a good time to re-evaluate one’s equity allocation and bring its geographic diversification into balance.
*******
Author
Jurrien Timmer | Director of Global Macro, Fidelity Global Asset Allocation Division
Jurrien Timmer is the director of Global Macro for the Global Asset Allocation Division of Fidelity Investments, specializing in global macro strategy and tactical asset allocation. He joined Fidelity in 1995 as a technical research analyst.
Fidelity Thought Leadership Vice President Matt Bennett provided editorial direction for this article.
*******
For Canadian investors
For Canadian prospects and/or Canadian institutional investors only. Offered in each province of Canada by Fidelity Investments Canada ULC in accordance with applicable securities laws.
Unless otherwise disclosed to you, in providing this information, Fidelity is not undertaking to provide impartial investment advice, or to give advice in a fiduciary capacity, in connection with any investment or transaction described herein. Fiduciaries are solely responsible for exercising independent judgment in evaluating any transaction(s) and are assumed to be capable of evaluating investment risks independently, both in general and with regard to particular transactions and investment strategies. Fidelity has a financial interest in any transaction(s) that fiduciaries, and if applicable, their clients, may enter into involving Fidelity’s products or services.
Information presented herein is for discussion and illustrative purposes only and is not a recommendation or an offer or solicitation to buy or sell any securities. Views expressed are as of the date indicated, based on the information available at that time, and may change based on market and other conditions. Unless otherwise noted, the opinions provided are those of the author and not necessarily those of Fidelity Investments or its affiliates. Fidelity does not assume any duty to update any of the information.
Investment decisions should be based on an individual’s own goals, time horizon, and tolerance for risk. Nothing in this content should be considered to be legal or tax advice and you are encouraged to consult your own lawyer, accountant, or other advisor before making any financial decision.
Stock markets, especially non-U.S. markets, are volatile and can decline significantly in response to adverse issuer, political, regulatory, market, or economic developments. Foreign securities are subject to interest rate, currency exchange rate, economic, and political risks, all of which are magnified in emerging markets.
Investing involves risk, including risk of loss. Past performance is no guarantee of future results. Diversification and asset allocation do not ensure a profit or guarantee against loss.
All indices are unmanaged. You cannot invest directly in an index.
Index definitions
Standard & Poor’s 500 (S&P 500®) Index is a market capitalization-weighted index of 500 common stocks chosen for market size, liquidity, and industry group representation to represent U.S. equity performance. S&P 500 is a registered service mark of The McGraw-Hill Companies, Inc., and has been licensed for use by Fidelity Distributors Corporation and its affiliates. MSCI Japan Index is a market capitalization-weighted index designed to measure the investable equity market performance for global investors of the developed markets in Japan. MSCI EAFE Index is a market capitalization-weighted index designed to measure the performance of large- and mid-cap stocks across developed markets around the world, excluding the U.S. and Canada. MSCI United Kingdom Index is a market capitalization-weighted index designed to measure the performance of the large- and mid-cap segments of the U.K. stock market. MSCI Europe Index is a market capitalization-weighted index designed to measure the investable equity market performance for global investors of the developed markets in Europe. MSCI All Country World ex-U.S. Index is a market capitalization-weighted index designed to measure the equity market performance of developed and emerging markets, excluding the U.S. MSCI AC Far East ex Japan Index is a market capitalization-weighted index designed to measure large- and mid-cap stock performance across two developed-market countries (excluding Japan) and seven emerging-market countries in the Far East. MSCI Mexico Index is a market capitalization-weighted index designed to measure the performance of the large- and mid-cap segments of the Mexican stock market. MSCI Canada Index is a market capitalization-weighted index designed to measure the performance of the large- and mid-cap segments of the Canadian stock market. MSCI Emerging Markets (EM) Index is a market capitalization-weighted index designed to measure the investable equity market performance for global investors in emerging markets. MSCI Emerging Markets EMEA Index is a market capitalization-weighted index designed to measure large- and mid-cap stock performance across 10 emerging markets countries in Europe, the Middle East, and Africa (EMEA). MSCI Germany Index is a market capitalization-weighted index designed to measure the performance of the large- and mid-cap segments of the German stock market. MSCI China Index captures large- and mid-cap representation across China H shares, B shares, Red chips, and P chips. With 150 constituents, the index covers about 85% of this China equity universe. MSCI India Index is a market capitalization-weighted index designed to measure the performance of the large- and mid-cap segments of the Indian stock market. MSCI Emerging Markets Latin America Index captures large- and mid-cap stock representation across five emerging-market countries in Latin America. The MSCI Emerging Markets Eastern Europe Index is a market capitalization-weighted index designed to measure the performance of large- and mid-cap stocks across the Czech Republic, Hungary, Poland, and Russia. The MSCI Russia Index is designed to measure the performance of the large- and mid-cap segments of the Russian market. With 21 constituents, the index covers approximately 85% of the free float-adjusted market capitalization in Russia.
Third-party marks are the property of their respective owners; all other marks are the property of Fidelity Investments Canada ULC.
If receiving this piece through your relationship with Fidelity Institutional Asset ManagementSM (FIAM), this publication may be provided by Fidelity Investments Institutional Services Company, Inc., Fidelity Institutional Asset Management Trust Company, or FIAM LLC, depending on your relationship.
If receiving this piece through your relationship with Fidelity Personal & Workplace Investing (PWI) or Fidelity Family Office Services (FFOS), this publication is provided through Fidelity Brokerage Services LLC, Member NYSE, SIPC.
If receiving this piece through your relationship with Fidelity Clearing and Custody Solutions or Fidelity Capital Markets, this publication is for institutional investor or investment professional use only. Clearing, custody, or other brokerage services are provided through National Financial Services LLC or Fidelity Brokerage Services LLC, Member NYSE, SIPC.
© 2017 Fidelity Investments Canada ULC. All rights reserved.
US: 791488.1.0 CAN: 792617.1.0