


by Ryan Detrick, LPL Research
Last week, we took a look at the Dow 10-day win streak and why it wasn’t as scary for future returns as many made it sound. That 10-day win streak also saw the Dow make 10 new all-time highs in a row, something that hasn’t happened since 1987. Could we have another 1987 on our hands? We’ll take a look and show why it may be unlikely.
When most investors hear “1987,” they immediately fear a 22% one-day crash is lurking. What is important to remember about that year though is the Dow was up 43% for the year as of late August, so some type of major snapback correction was incredibly likely. Also, the Dow did finish higher in 1987. Sure it was by only 2%, but most investors don’t realize that. So could another 1987-type correction be around the corner? We would say no, and the reason again is how stretched things were then versus now. After rising the first 13 trading days of 1987 (12 of them making new highs), the Dow gained nearly another 30% over the following eight months! With the Dow up about 6% so far in 2017, there’s a long way to go before it becomes as stretched as it was in 1987. That isn’t to say a normal correction after the big surge since the U.S. election isn’t possible, it is, but a major bear market correction is still something we’d call a low percentage scenario right now.
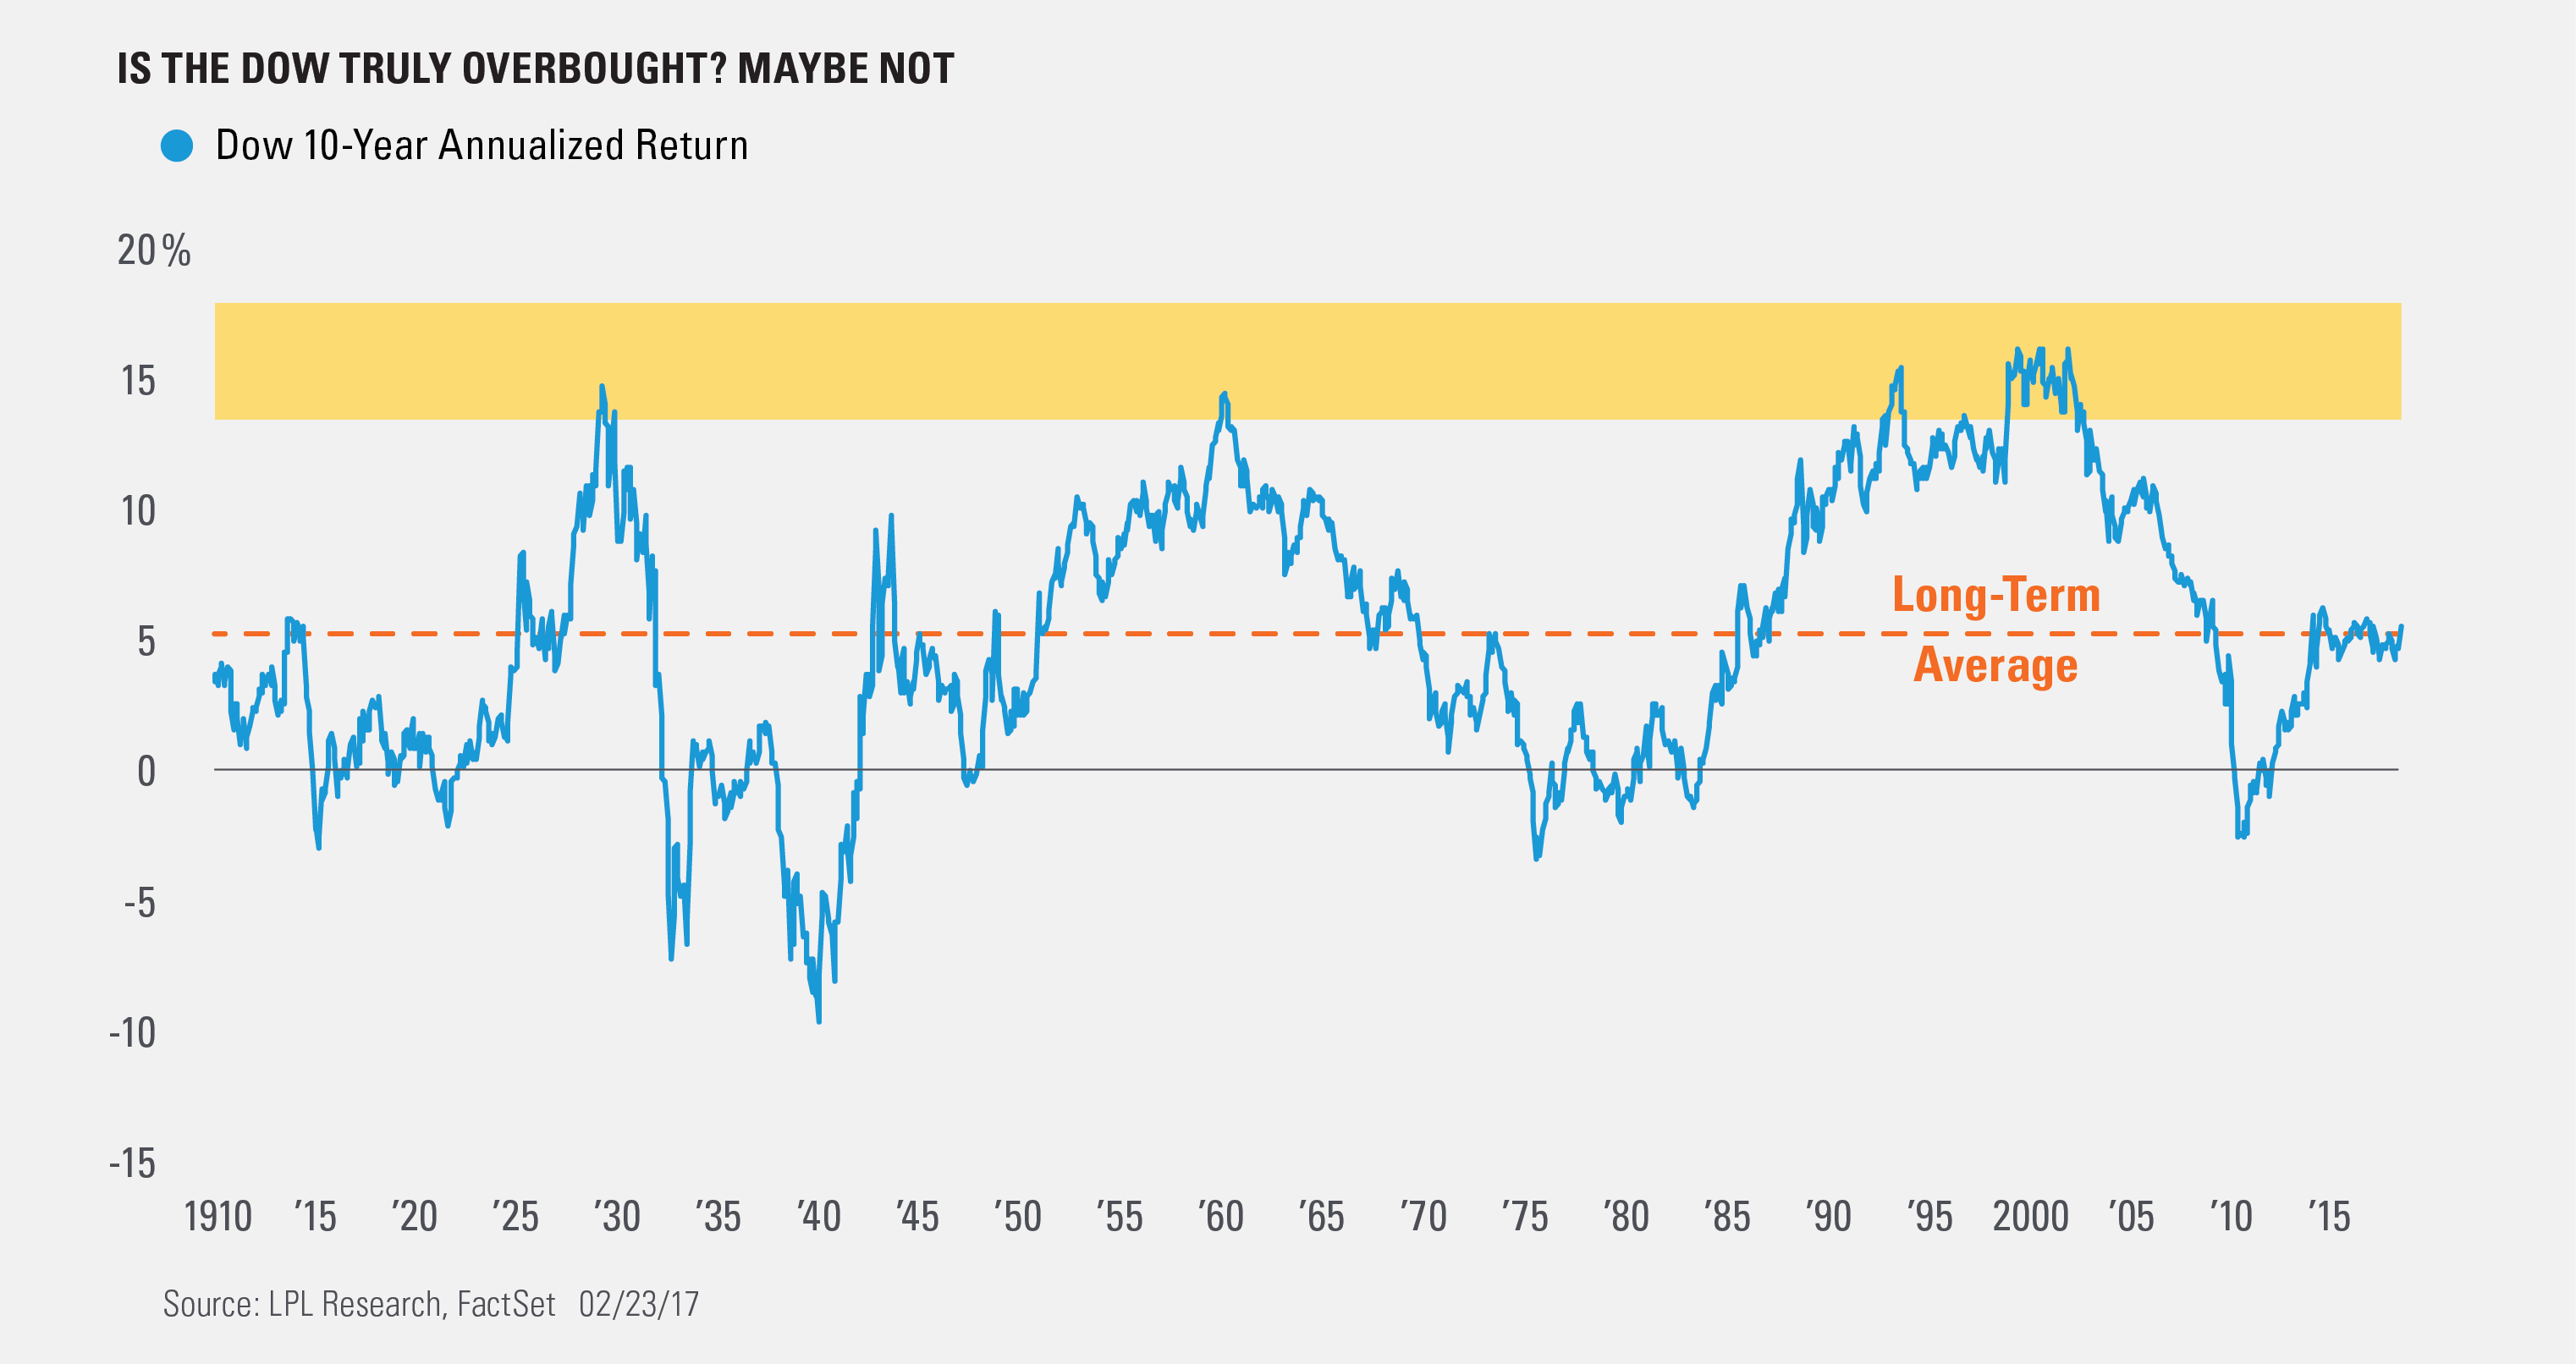
Per Ryan Detrick, Senior Market Strategist, “Markets might feel near-term extended, and they are by nearly any momentum oscillator* you want to use. But did you know that over the past 10 years, the Dow has been up only 5.4% on an annualized basis? Going back to 1900, the annual average return has been 5.1%. This puts in perspective how on a longer-term basis, the Dow could still have room to run should the economy continue to improve.”
******
IMPORTANT DISCLOSURES
* The momentum oscillator is an indicator used in technical analysis and represents the rate of change of a security’s price.
Past performance is no guarantee of future results. All indexes are unmanaged and cannot be invested into directly.
The opinions voiced in this material are for general information only and are not intended to provide or be construed as providing specific investment advice or recommendations for any individual security.
The economic forecasts set forth in the presentation may not develop as predicted.
Investing in stock includes numerous specific risks including: the fluctuation of dividend, loss of principal and potential illiquidity of the investment in a falling market.
Dow Jones Industrial Average (DIJA) is the most widely used indicator of the overall condition of the stock market, a price-weighted average of 30 actively traded blue-chip stocks, primarily industrials. The 30 stocks are chosen by the editors of the Wall Street Journal. The Dow is computed using a price-weighted indexing system, rather than the more common market cap-weighted indexing system.
This research material has been prepared by LPL Financial LLC.
To the extent you are receiving investment advice from a separately registered independent investment advisor, please note that LPL Financial LLC is not an affiliate of and makes no representation with respect to such entity.
Not FDIC/NCUA Insured | Not Bank/Credit Union Guaranteed | May Lose Value | Not Guaranteed by any Government Agency | Not a Bank/Credit Union Deposit
Securities and Advisory services offered through LPL Financial LLC, a Registered Investment Advisor Member FINRA/SIPC
Copyright © LPL Research