by Ryan Detrick, LPL Research
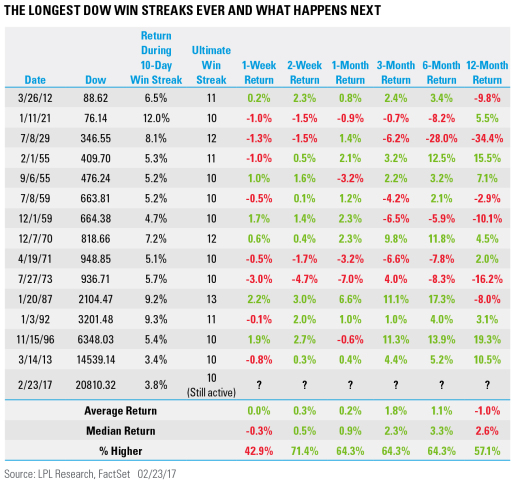
The Dow is up an incredible 10 days in a row, for the longest winning streak since March 2013. What makes the win streak extra special is that each of those days marked a new record high, with January 1987 being the last time that happened.
Going back to 1900, this is the fifteenth time the Dow has had a 10-day win streak. The past two times this happened, in November 1996 and March 2013, the Dow was up another 19.3% and 10.5% a year later, respectively. After the streak ends, it is normal to see continued near-term strength, with the Dow having been up 1.8% on average over the subsequent three months; however, going out six months to a year the returns have historically been rather muted. Another important point is that we did see long win streaks ahead of the Great Depression in 1929 and before the bear market of ‘73/’74, so those returns are greatly impacting longer-term returns. Of course, those streaks preceded recessions, although we still believe one is unlikely to occur over the next 12 months. Finally, it is worth noting the Dow is up only 3.8% during this win streak, one of the weakest returns ever during a 10-day win streak.
Per Ryan Detrick, Senior Market Strategist, “Long win streaks tend to bring with them a fear of heights, as we all know what goes up must come down. It isn’t quite that simple though when it comes to investing, as history has shown if the economy doesn’t enter a recession soon after these long win streaks, continued gains are very possible. Sure, a well-deserved pullback is possible at any time here, but to say a long win streak means a coming bear market is simply wrong and the data would support this.”
On Monday, we will take another look at this streak and show why on a much longer-term basis, the Dow might not be as overextended as many think.
IMPORTANT DISCLOSURES
Past performance is no guarantee of future results. All indexes are unmanaged and cannot be invested into directly.
The opinions voiced in this material are for general information only and are not intended to provide or be construed as providing specific investment advice or recommendations for any individual security.
The economic forecasts set forth in the presentation may not develop as predicted.
Investing in stock includes numerous specific risks including: the fluctuation of dividend, loss of principal and potential illiquidity of the investment in a falling market.
Dow Jones Industrial Average (DIJA) is the most widely used indicator of the overall condition of the stock market, a price-weighted average of 30 actively traded blue-chip stocks, primarily industrials. The 30 stocks are chosen by the editors of the Wall Street Journal. The Dow is computed using a price-weighted indexing system, rather than the more common market cap-weighted indexing system.
This research material has been prepared by LPL Financial LLC.
To the extent you are receiving investment advice from a separately registered independent investment advisor, please note that LPL Financial LLC is not an affiliate of and makes no representation with respect to such entity.
Not FDIC/NCUA Insured | Not Bank/Credit Union Guaranteed | May Lose Value | Not Guaranteed by any Government Agency | Not a Bank/Credit Union Deposit
Securities and Advisory services offered through LPL Financial LLC, a Registered Investment Advisor Member FINRA/SIPC
Tracking # 1-585087 (Exp. 2/18)


