

by Jodie Gunzberg, Global Head of Commodities and Real Assets, S&P Dow Jones Indices
After OPEC agreed to an oil output cut in Algiers on Sep. 29, they increased supply by 230 kb/d to a record 33.83 mb/d in October according to the International Energy Agency (IEA). Supply from Iraq reached the highest level ever and Iran pushed flows to a pre-sanctions rate of 3.72 mb/d. Now OPEC supply has increased by 1.3 mb/d from last year while output has risen for five consecutive months.
It is difficult to see how implementing the cuts will work with the resistance from Iraq and Iran. Even if the OPEC coordination worked, the resulting cuts may be ineffective because there are currently more powerful forces on oil price. Two possible factors that are more critical to oil price formation, but ones that are even harder to control are the Chinese demand and U.S. production.
The Chinese have been strategic about buying and selling commodities so may buy more oil as the prices drop if OPEC does not cut supply. China also has the power to heat the competition on the supply side by shopping around. Conversely if OPEC does cut and oil prices increase, China may use their own reserves – or even worse – might export into the open market, essentially keeping the oil range-bound, which could reach between $25 – $85 dollars before reaching unprecedented levels according to index return history.
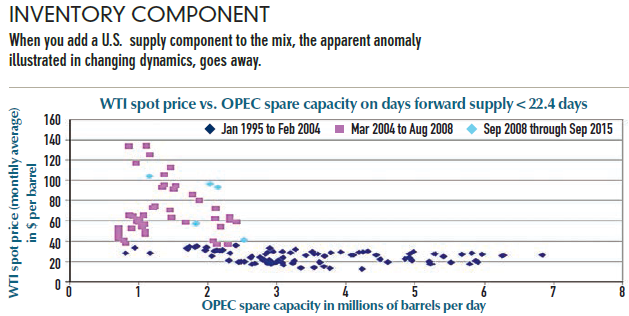
The U.S. production is also a key driver that is possibly more important for oil prices than OPEC’s decision. OPEC has the ability to be the swing producer given its large market share, spare capacity, low production costs and capability of acting alone or in a cartel; however, U.S. inventories need to be low for it to matter.
Source: Bloomberg, IEA.
The U.S. companies act independently and have already cut back production so further output reduction may be limited at today’s price levels. This is reflected in the magnitude reduction of the large negative roll return seen in the second quarter of this year. The competition between U.S. producers is apparent versus the stability of the state run OPEC in the volatility of the roll return between WTI and Brent where WTI has bigger excesses and shortages than Brent.
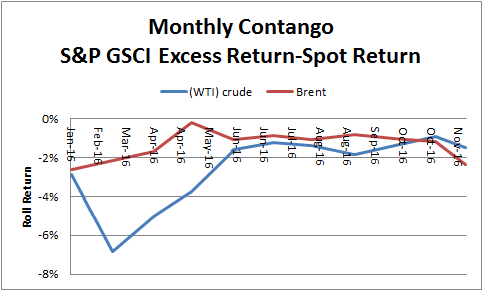
Source: S&P Dow Jones Indices
The U.S. producers may move quickly to fill the gap if OPEC cuts. The low oil price forced consolidation to improve efficiencies bringing down the cost of production. The race has changed from a race for land to a race for efficiency. The increase in efficiency should bring the oil production back faster than in 1998 or 2009 – it is said to be roughly 9 months.
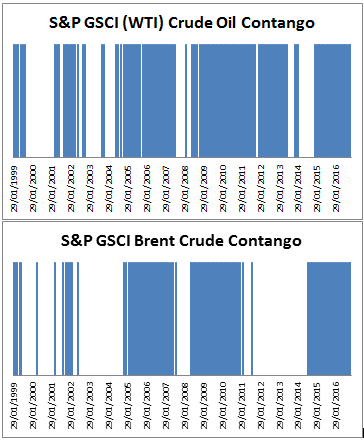
If OPEC fails to cut output, it will likely lengthen the rebalancing. One interesting result in the S&P GSCI Brent Crude is that it’s on the cusp of the longest consecutive monthly contango in history (as measured by the negative roll return of the index since 1999, and greater negative roll returns reflect higher excess inventory and storage costs.)
Also, after the 2008 period, the indices show WTI crude took about 6 years before the excess inventory turned into a shortage. We’re now only two years into the current glut, so the rebalance may take several more years.
- November is the 29th month in a row in contango, only beaten by a longer streak of 32 months from May 2008 – Nov 2010.
- This Nov. Brent is showing the 2nd highest contango of any Nov. in history with a -2.4% roll return, only second to Nov, in 2008 when the negative roll return was -2.7%. It is almost 10x the average negative roll return of -0.29% in Nov.
- Brent’s current negative roll of -2.4% has doubled from Oct. and is the highest since Jan. 2016
WTI’s negative roll has also almost doubled from -0.9% in Oct. to -1.5% now, but is only a fraction of Feb’s levels when inventory started to pull back. This shows the relative flexibility in the US production at work.
Source: S&P Dow Jones Indices
Other macro factors that may be less direct though still influential include the dollar, interest rates and inflation:
- If the dollar strengthens, oil is one of the most negatively impacted, losing on average about 1.7% for every 1% rise in the USD. If dollar falls it is much more powerful, boosting oil about 4.5% for every 1% drop in the USD.
- Rising interest rates are potentially good for oil futures from the higher margin collateral and interest from storage that push futures price up.
- Energy has a high inflation beta, meaning oil performs well with inflation. If inflation rises 1%, there is about 15% increase in the S&P GSCI (70% energy) and 11% Dow Jones Commodity Index (DJCI about 33% energy)
- This works globally except in countries that regulate price (like Mexico and S. Africa). Oil is most sensitive to Eurozone inflation followed by US CPI and then Australia and Asia.
Last, if OPEC cuts and the price rises in the near-term, it is important to consider the impact of the seasonal demand versus true supply impact. Coming into the winter months, the cold weather generally helps support oil. In the meantime, for the passive investor that might be long oil through this time of term structure volatility in the sea of excess oil, dynamic and enhanced rolling strategies are known to have added 2-3% in negative months for oil.
Copyright © S&P Dow Jones Indices