by LPL Research
As America heads to the polls tomorrow to elect our next leader, many questions have come up. The most logical from an investment point of view is what will happen to equities. We addressed this important subject last week in Could There Be A Big Sell-Off After The Election? Taking another look at this, today we’ll break down what has happened historically from election day until inauguration day.
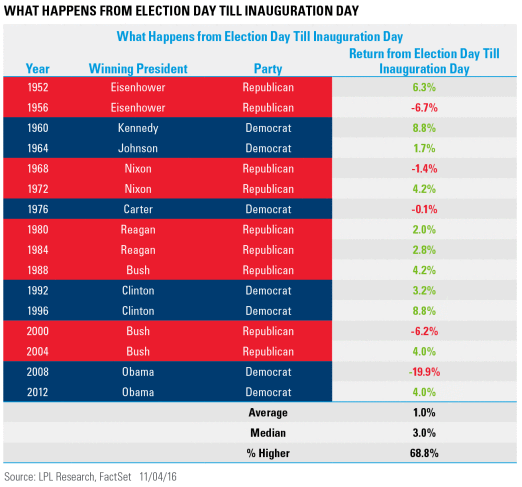
Going back to 1952*, the S&P 500 has gained from election day until inauguration day in 11 out of 16 elections for an average return of 1.0%. The median return jumps up to 3.0%, as things are greatly skewed by the huge 19.9% drop during the financial crisis.
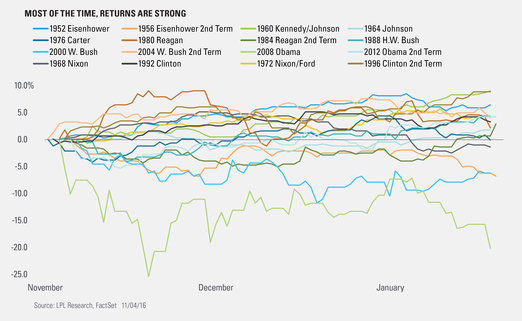
The reality is if the economy is on firm footing and not in a recession (2008) or falling into a recession (2000), most the time the returns have been rather strong for the S&P 500. Considering the economy currently is probably the best economy an incoming president has inherited since Clinton in 1992, this could be another plus for equities after this election.
Last, here’s another look at all the returns after elections since 1952.
IMPORTANT DISCLOSURES
Past performance is no guarantee of future results.
The economic forecasts set forth in the presentation may not develop as predicted.
The opinions voiced in this material are for general information only and are not intended to provide or be construed as providing specific investment advice or recommendations for any individual security.
Investing in stock includes numerous specific risks including: the fluctuation of dividend, loss of principal and potential illiquidity of the investment in a falling market.
* Any data prior to March 4, 1957 is back-tested, as published by the index’s parent company, S&P DOW Jones Indices. All information for an index prior to its Launch Date is back-tested, based on the methodology that was in effect on the Launch Date. Back-tested performance, which is hypothetical and not actual performance, is subject to inherent limitations because it reflects application of an Index methodology and selection of index constituents in hindsight. No theoretical approach can take into account all of the factors in the markets in general and the impact of decisions that might have been made during the actual operation of an index. Actual returns may differ from, and be lower than, back-tested returns.
The S&P 500 Index is a capitalization-weighted index of 500 stocks designed to measure performance of the broad domestic economy through changes in the aggregate market value of 500 stocks representing all major industries.
Indices are unmanaged index and cannot be invested into directly. Unmanaged index returns do not reflect fees, expenses, or sales charges. Index performance is not indicative of the performance of any investment.
This research material has been prepared by LPL Financial LLC.
To the extent you are receiving investment advice from a separately registered independent investment advisor, please note that LPL Financial LLC is not an affiliate of and makes no representation with respect to such entity.
Not FDIC/NCUA Insured | Not Bank/Credit Union Guaranteed | May Lose Value | Not Guaranteed by any Government Agency | Not a Bank/Credit Union Deposit
Securities and Advisory services offered through LPL Financial LLC, a Registered Investment Advisor Member FINRA/SIPC
Tracking # 1-552874 (Exp. 11/17)
Copyright © LPL Research


