by LPL Research
Here’s the problem with averages—they aren’t always average. Remember the classic tale about the statistician who couldn’t swim and drowned while crossing a river that was three feet deep on average? Averages are fine; it is the outliers that can get you.
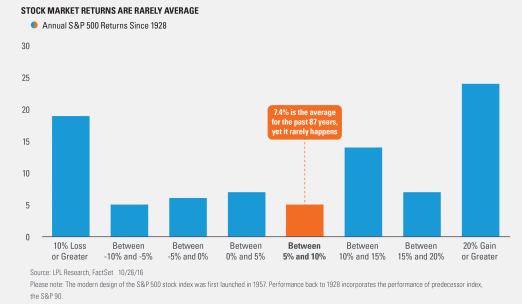
What does this have to do with the stock market? Looking back to 1928, the average yearly return on the S&P 500 has been 7.4% excluding dividends. Here’s the catch: Only five out of those 87 years did the S&P end the year between five and 10 percent higher! So less than six percent of all years since the Great Depression saw yearly returns at what most of us would consider about average. Talk about some deep rivers.
Think back to your high school statistics class and what a normal distribution looks like. Let’s just say it doesn’t look much like the chart above, that’s for sure. What does this all mean? According to Ryan Detrick, Senior Market Strategist, “The stock market has a way of making what we consider to be ‘average’, in fact, rather rare. A yearly S&P 500 return between zero and ten percent takes place less than 14% of the time, while gains of more than 20% or less than 20% take place nearly 27% of the time! Don’t be fooled by the flaw of averages.”
Over the long run, the stock market has a strong bullish bias and the power of compounding has created massive amounts of wealth over many decades. Just don’t expect it to be a smooth ride along the way, and if anything, don’t expect it to be average.
*****
IMPORTANT DISCLOSURES
Past performance is no guarantee of future results.
The economic forecasts set forth in the presentation may not develop as predicted.
The opinions voiced in this material are for general information only and are not intended to provide or be construed as providing specific investment advice or recommendations for any individual security.
Investing in stock includes numerous specific risks including: the fluctuation of dividend, loss of principal and potential illiquidity of the investment in a falling market.
The S&P 500 Index is a capitalization-weighted index of 500 stocks designed to measure performance of the broad domestic economy through changes in the aggregate market value of 500 stocks representing all major industries.
Indices are unmanaged index and cannot be invested into directly. Unmanaged index returns do not reflect fees, expenses, or sales charges. Index performance is not indicative of the performance of any investment.
This research material has been prepared by LPL Financial LLC.
To the extent you are receiving investment advice from a separately registered independent investment advisor, please note that LPL Financial LLC is not an affiliate of and makes no representation with respect to such entity.
Not FDIC/NCUA Insured | Not Bank/Credit Union Guaranteed | May Lose Value | Not Guaranteed by any Government Agency | Not a Bank/Credit Union Deposit
Securities and Advisory services offered through LPL Financial LLC, a Registered Investment Advisor Member FINRA/SIPC
Tracking # 1-549390 (Exp. 10/17)
Copyright © LPL Research


