
by Corey Hoffstein, Newfound Research
We have a pretty arbitrary practice in the financial services industry: we reset the performance clock of portfolios to zero every January.
Consider this hypothetical scenario: it’s December and markets are up 20% for the year. They even got a nice 5% pop in the last month. The clock strikes midnight on December 31st. We roll into January and the markets proceed to tumble -3% in the first week.
Headlines won’t call it a “healthy consolidation off of a terrific 12-month number.”
No. Headlines will read: “A Bad Start to the Year.”
January resets our frame of mind.
Which is perhaps why this most recent drawdown has been so hard to stomach compared to past market losses, despite being nearly inline with losses in 2012 and less than both 2011 and 2010.
Investors looking at their equity portfolios this morning are going to see an S&P 500 year-to-date number of about -8%.
And, being honest, they’re going to round up and frame it as: “wow, 8 months and I’ve lost 10% of my net worth.”
But is this pull-back really all that different than those of past years?
May through June 2010 saw a -16% drawdown. May through August 2011 was a -17% drawdown. We even saw a -7% drawdown last October.
But those drawdowns all had one key thing in common: their starting year-to-date performance number was much, much higher.
| Start | End | YTD Before | Drawdown | YTD After |
| 04/26/2010 | 06/07/2010 | 9.3% | -16% | -7.4% |
| 05/10/2011 | 08/22/2011 | 8.5% | -17% | -9.6% |
| 04/03/2012 | 06/04/2012 | 13.0% | -10% | 2.5% |
| 05/21/2013 | 06/24/2013 | 17.9% | -6% | 11.3% |
| 09/19/2014 | 10/16/2014 | 10.0% | -7% | 2.3% |
| 07/21/2015 | 08/25/2015 | 3.8% | -12% | -8.0% |
When investors are “up” on the year, initial losses just look like “house money.” So in the first 5 cases above, the market could sell-off 8-10% before it looked to investors like they started losing principle.
Which is when they really start to care.
Except in reality, the game never resets. It’s a running score.
That’s the danger with resetting the performance clock in January. It reframes what’s “house money” and what’s “my money.” When we reset to zero, gains of the past year seem locked in.
Perhaps that’s what has made this most recent drawdown so difficult to stomach.
At peak on July 21, 2015, the S&P 500 was up only approximately 4%. So it wasn’t long before we hit negative year-to-date numbers and it looked like dipped into “real loss” territory.
So despite the fact that the drawdown in the S&P 500 is only about -12% at the moment – less than both 2010 and 2011 – this sell-off might feel much worse to an investor who is looking at their year-to-date number. At a -12% drawdown in 2010 and 2011, markets were only slightly down – not the -8% we’re down now.
And that’s why year-to-date is such a dangerous figure to quote. It doesn’t tell the whole story.
So what’s a better way to look at the most recent losses? Well, being 162 trading days into the year, we can look at running 162-trading-day performance metrics.
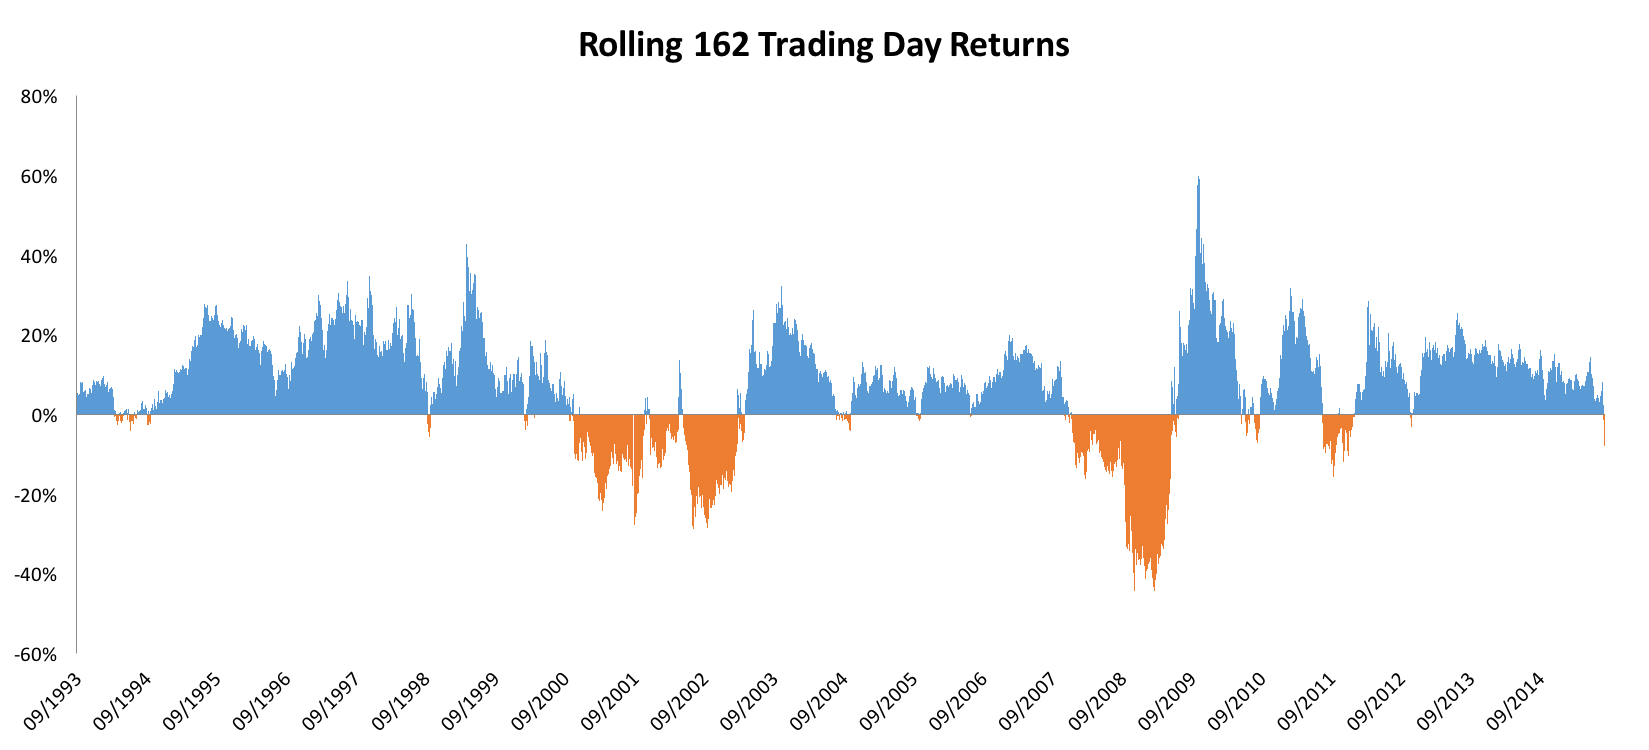
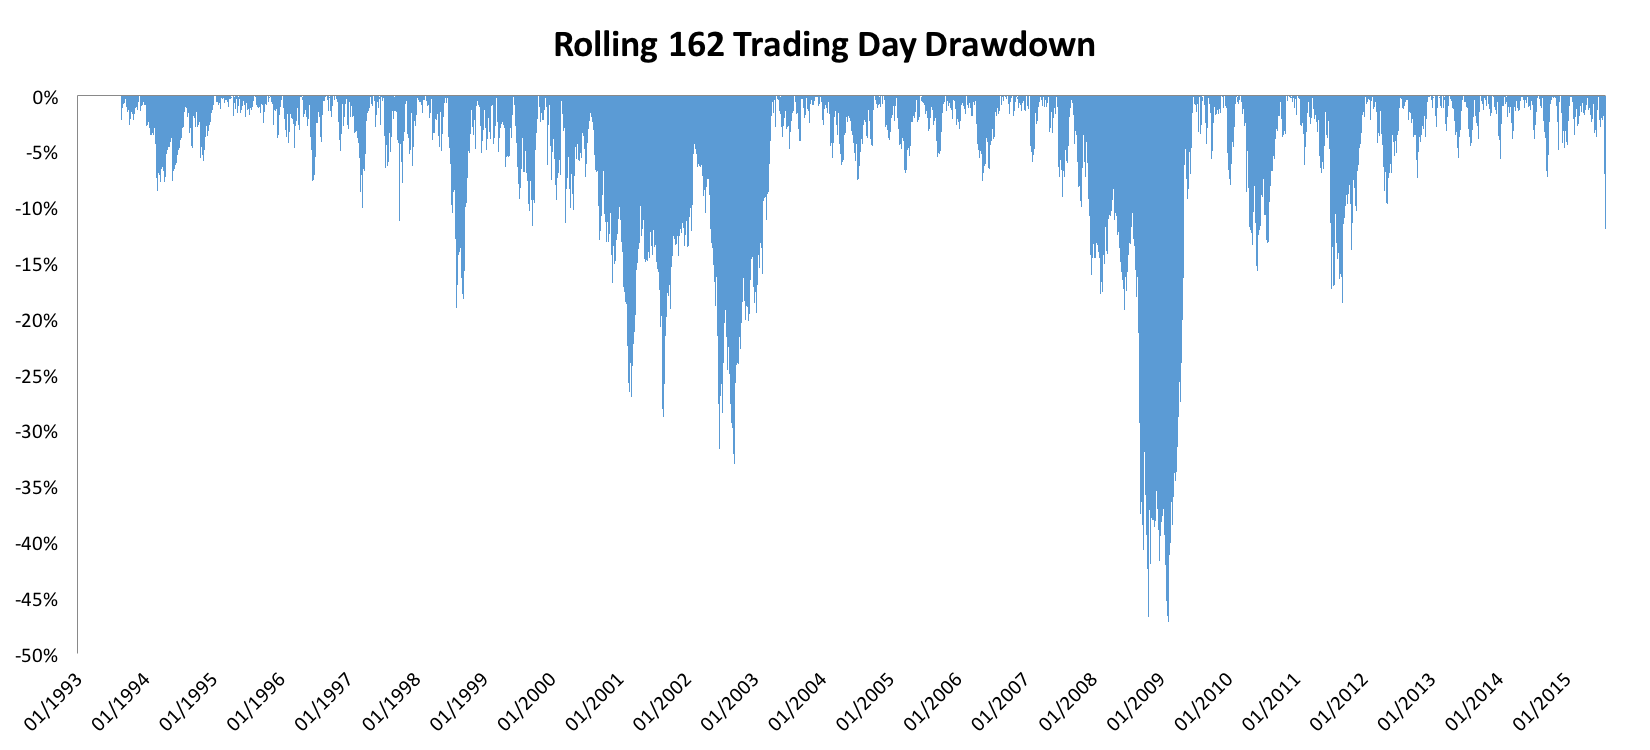
We can see that in the cases of both trailing 162-day realized returns and trailing 162-day drawdown, the most recent losses are well in-line with how equity markets can behave. And we can see that this most recent sell-off is not any more severe than 2010 or 2011.
And even periods like 1998 and 1999 show that they had their own strong pull-backs.
Volatility is the price we pay to invest in equity markets. Without risk, there is no reward.
But in cases like these, year-to-date numbers can be downright misleading when it comes to understanding risk.
That isn’t to say that this pullback isn’t different than the pullbacks we’ve seen in the last 5 years. We’re certainly seeing a considerable amount of negativity in our models. But it certainly isn’t out-of-line for what can happen in a healthy bull markets.
It’s just that the year-to-date number might be playing tricks on our mind.
Copyright © Newfound Research