


Where Growth Comes From
by Brad McMillan, CIO, Commonwealth Financial Network
Yesterday we talked about productivity and growth, with a sidelight on how recent low levels of growth are largely due to low business investment. Although that is certainly true, there’s more to the story.
Let’s take a deeper look at where growth has come from during this recovery and what that might mean for the future.
The 4 components of economic growth
Let’s start at the top. This is kind of a busy chart, but basically it looks at the four components of economic growth—government spending, exports less imports, business investment, and consumer spending—and shows how much they contributed to growth.
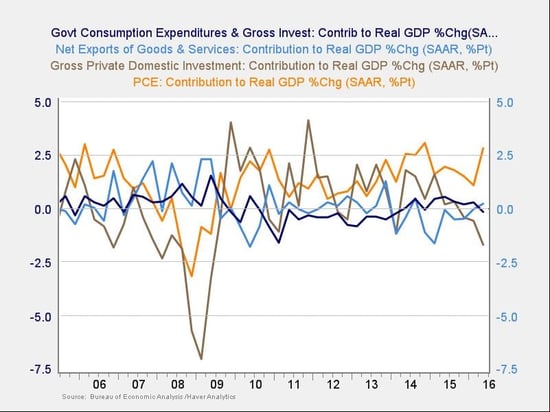
- Consumer spending (orange line): You can see that spending shrunk and detracted from growth in 2008–2009 but otherwise has been very additive, especially recently.
- Government spending (black line): Similarly, you can see that government spending hurt growth since the crisis until lately, then was additive, and most recently has hurt growth again. Note, though, that since the crisis, its contribution has been relatively small either way.
- Net exports (blue line): Exports have bounced around and right now are pretty much neutral.
- Business investment (brown line): Business investment has generally been additive, but it has dropped sharply recently.
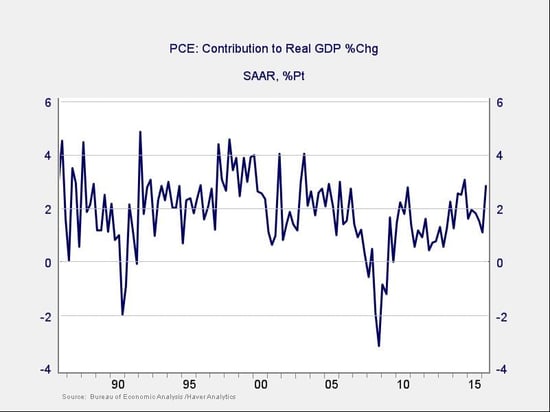
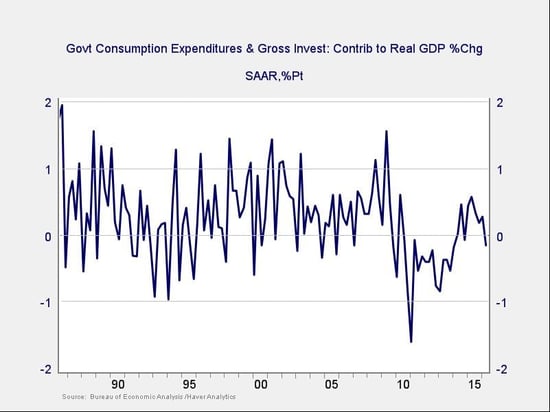
Now, let’s take a look at these data points over a longer time frame (30 years) to see if the trends since the crisis are typical. Net exports have bounced around between positive and negative over that period, so on balance, it looks like not much has changed. The other three components are more interesting, however.
Consumer spending growth used to add between 2 percent and 4 percent to growth; more recently, it has been around 2 percent to 3 percent at best, a loss of around 1 percent. Clearly, the slowdown in consumer spending growth is a major reason that overall growth has slowed.
Government spending has also contributed less, from an average of around 0.5 percent to about –0.5 percent, a loss of 1 percent. This has been partially due to the crisis but largely—especially in recent years—to cuts in federal spending, mandated by the sequester agreement that averted the fiscal cliff. Remember that?
Business investment, the final piece of the puzzle, shows a different trend. Historically, this component has added around 1.5 percent to growth, and since the crisis, it has actually run at around the same rate, unlike consumer and government spending. More recently, however, it has dropped down into negative territory and is now subtracting from typical growth levels at a rate of around 1 percent to 2 percent.

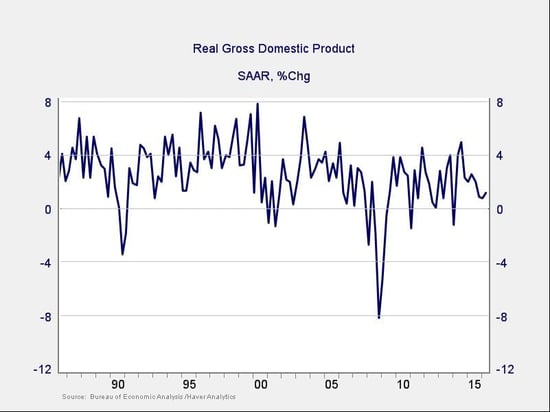
Putting these pieces together, and looking at overall economic growth, we can see the reason for the decline from around 4 percent in the 1990s and much of the 2000s to around 1–2 percent now. Since the crisis, we are losing consistently in two area, and the third has recently turned down as well.
Why are these components declining?
Government is easy: Congress, in the form of the sequester, made a decision to cut spending significantly. This has had positive effects—heard anything about the deficit recently?—but it has also slowed economic growth.
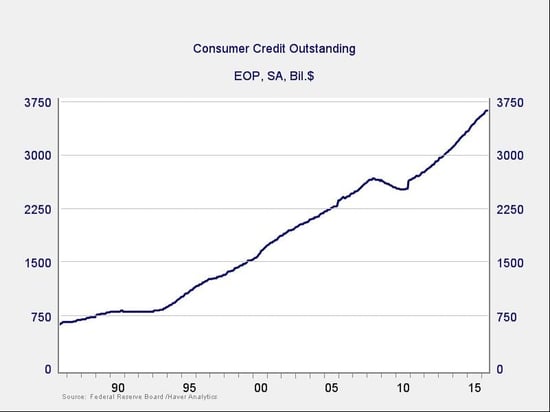
Slower consumer spending growth also makes sense. After almost quadrupling their debt from 1986 through 2006, as shown in the chart below, consumers had to take time to rest and pay off some of what they owed. Although credit growth has resumed, on a percentage basis, it is slower—and that is showing up in slower economic growth as well.
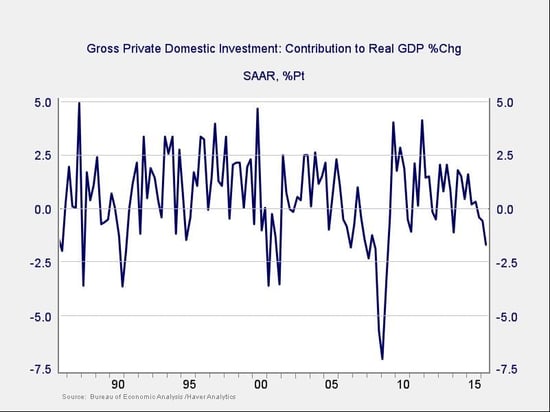
Finally, of course, there is business investment, which is where we started this discussion. Here again, we see that the contribution to growth has been pretty consistent with historical levels over much of the time since the crisis. It is only recently that it has fallen off, but that decline is consistent with levels we last saw in earlier recessions.
Are we in a recession?
Almost certainly not. If we dig a bit deeper, we see that much of the decline in business investment has been due to inventory adjustments, or companies buying less to keep in stock. This could be an indicator of a slowdown; indeed, that would make sense given the slowdown we have just seen. It does not, however, mean that inventory adjustment can continue forever.
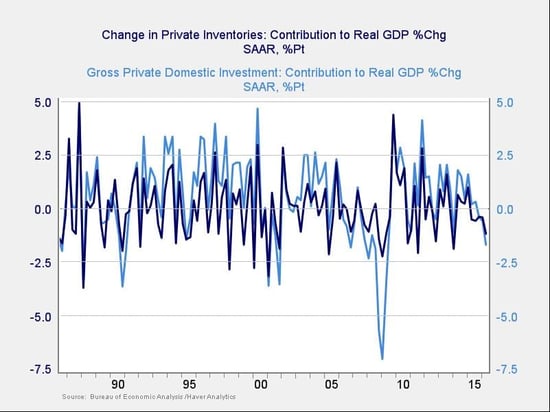
Looking at inventory changes, we see that there are often dips during slowdowns. In the chart below, we can see dips in the usual suspects, 2000 and 2009, but we also see similar dips in 1993, 1996, 2002, 2011, and 2015/2016—all times when the economy was still growing and businesses were forced to build their inventories back up after running them down.
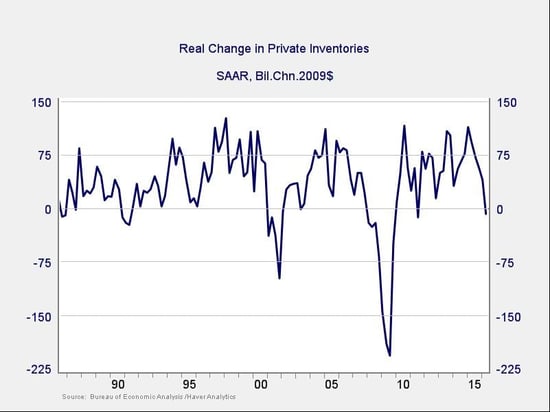
Note that dips as low as the current one were typically followed by strong bounces, which would actually help growth.
What does all of this tell us?
In short, that growth is unlikely to accelerate significantly unless consumers start spending more and the government steps up its expenditures. In other words, we are probably stuck with slow growth for some time to come.
It also tells us, however, that the current downturn in business investment is more cyclical than systemic and likely to reverse from hurting growth to helping it. Although no one loves slow growth, this is good news.
We’re not out of the woods yet, but we're at least continuing to move in the right direction.
Commonwealth Financial Network is the nation’s largest privately held independent broker/dealer-RIA. This post originally appeared on Commonwealth Independent Advisor, the firm’s corporate blog.
Copyright © Commonwealth Financial Network