by Don Vialoux, Timingthemarket.ca
Daily Observation
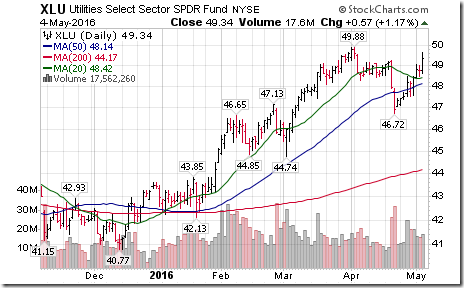
Technical deterioration for most equity markets and sectors continued yesterday. Notable was
deterioration by indices, commodities and sectors below their 20 day moving average. The
exception was strength in the Utilities sector.
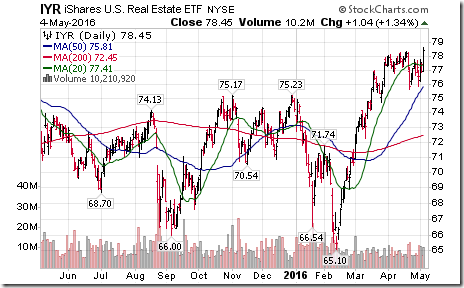
REITs and related ETFs also were notably higher.
StockTwits Released Yesterday @EquityClock
Commodity currencies gyrate following surprise rate cut from Australian Central Bank
Technical action by S&P 500 stocks to 10:15: Bearish. Breakout: $ICE. Breakdowns: $UA,
$JWN, $M, $PCLN, $ILMN, $HSIC, $GILD, $ANTM, $EXPD, $RHT.
Editor’s Note: After 10:15 AM EDT, technical action by S&P 500 stocks was mixed.
Breakouts: HCP, KIM, SRE, DPS. Breakdowns: IVZ, ABC, MU, EMR
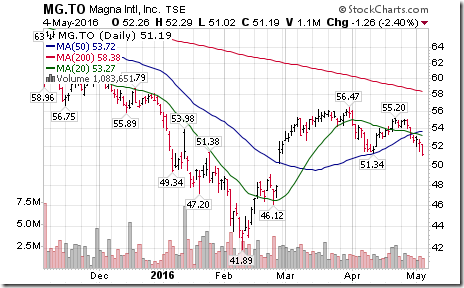
Magna Int’l $MG.CA broke support at $51.34 to establish a new intermediate down turn.
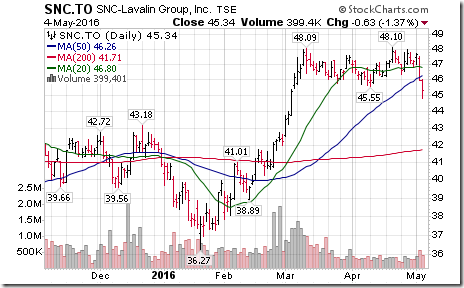
SNC Lavalin $SNC.CA broke support at $45.55 to complete a double top pattern.
Trader’s Corner
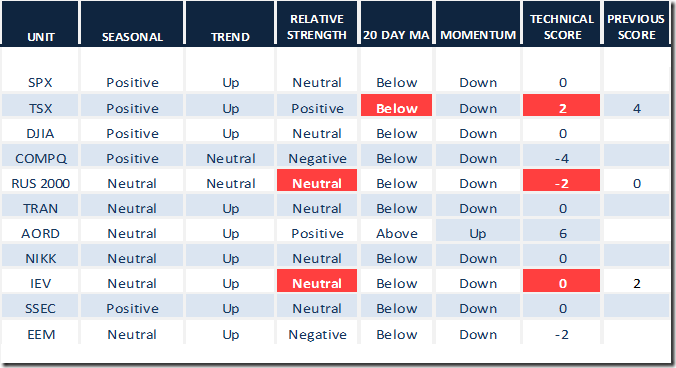
Daily Seasonal/Technical Equity Trends for May 4th 2016
Green: Increase from previous day
Red: Decrease from previous day
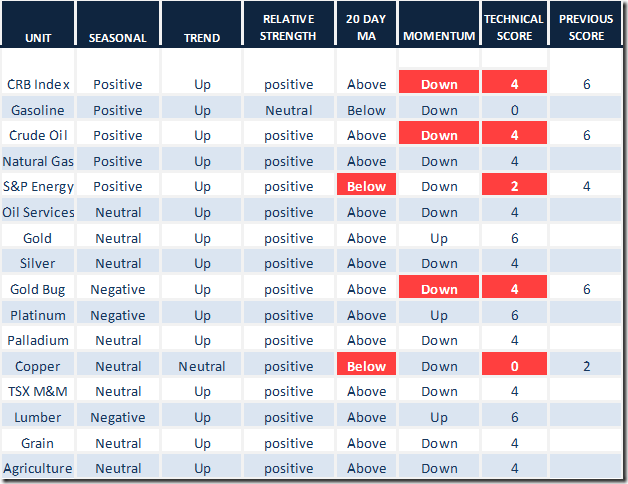
Daily Seasonal/Technical Commodities Trends for May 4th 2016
Green: Increase from previous day
Red: Decrease from previous day
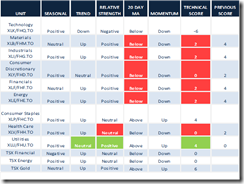
Daily Seasonal/Technical Sector Trends for March May 4th 2016
Green: Increase from previous day
Red: Decrease from previous day
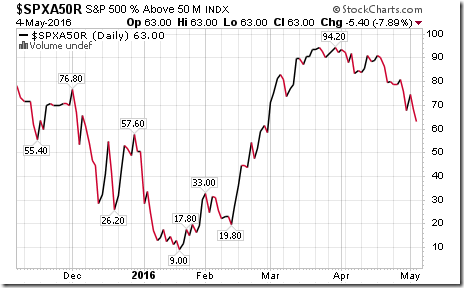
S&P 500 Momentum Barometer
The Barometer lost another 5.40 to 63.00 yesterday. It remains intermediate overbought and
trending down.
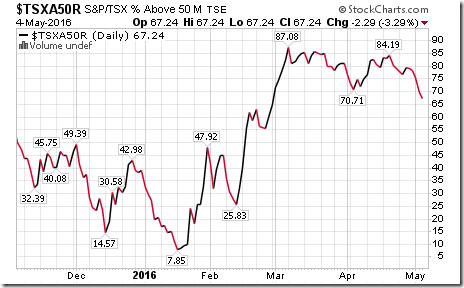
TSX Composite Momentum Barometer
The Barometer lost another 2.29 to 67.24 yesterday. It remains intermediate overbought trending
down.
Special Free Services available through www.equityclock.com
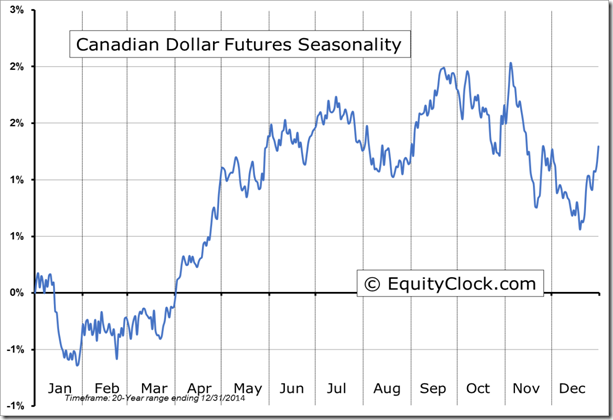
Equityclock.com is offering free access to a data base showing seasonal studies on individual
stocks and sectors. The data base holds seasonality studies on over 1000 big and moderate cap
securities and indices. To login, simply go to http://www.equityclock.com/charts/ Following
is an example:
Disclaimer: Seasonality and technical ratings offered in this report by www.timingthemarket.ca and www.equityclock.com are for information only. They should not be considered as advice to purchase or to sell mentioned securities. Data offered in this report is believed to be accurate, but is not guaranteed
Copyright © DV Tech Talk, Timingthemarket.ca


