Data-Driven Perspective on a Rough Start to 2016
by Burt White, Chief Investment Officer, LPL Financial
KEY TAKEAWAYS
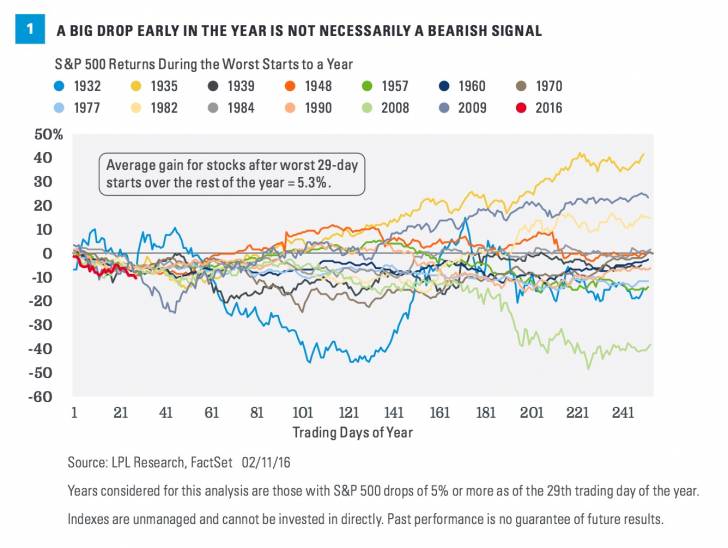
· Down 8.8% though 29 trading days, 2016 is the third worst start for stocks over the past nearly 90 years.
· A comparison of market, sentiment, technical and fundamental indicators to prior bear market lows provides some encouraging signs.
· We do see several potential catalysts that could help stocks over the next several months, and a bear market may not necessarily be in the cards.
It has been a rough start to 2016 for the stock market. In fact, it’s been one of the worst starts to a year in the history of the S&P 500. This week we look at how stocks have done historically after other similarly bad starts, compare current fundamental and technical conditions to prior bear market lows, and discuss some potential catalysts that could help turn stocks around. While recession odds have risen (we place the odds at about 30%), we do not expect the S&P 500, down 12.5% from 2015 highs, to enter a bear market.
Down 8.8% though 29 trading days, 2016 is the third worst start for stocks over the past nearly 90 years. Going back all the way to 1928, the S&P 500 Index (and its predecessor S&P Index) has been down at least 5% on the 29th trading day of the year 19 other times. So what has happened the rest of the year? The good news is that after a bad start, for the rest of the year the S&P 500 has averaged a gain of 5.3% (the median is also 5.3%), and the rest of the year has been positive 58% of the time. The best rallies after bad starts were 49% in 1935 and 36% in 2003. Going back 40 years, the S&P 500 has been down 5% or more after 29 trading days 10 other times besides this year. The rest of the year was down more than 10% only once, in 2008. That year saw a 33% drop from the 29th trading day until the end of the year. In other words, a sizable drop from here for the rest of the year would be extremely rare [Figure 1].
HISTORICAL PERSPECTIVE
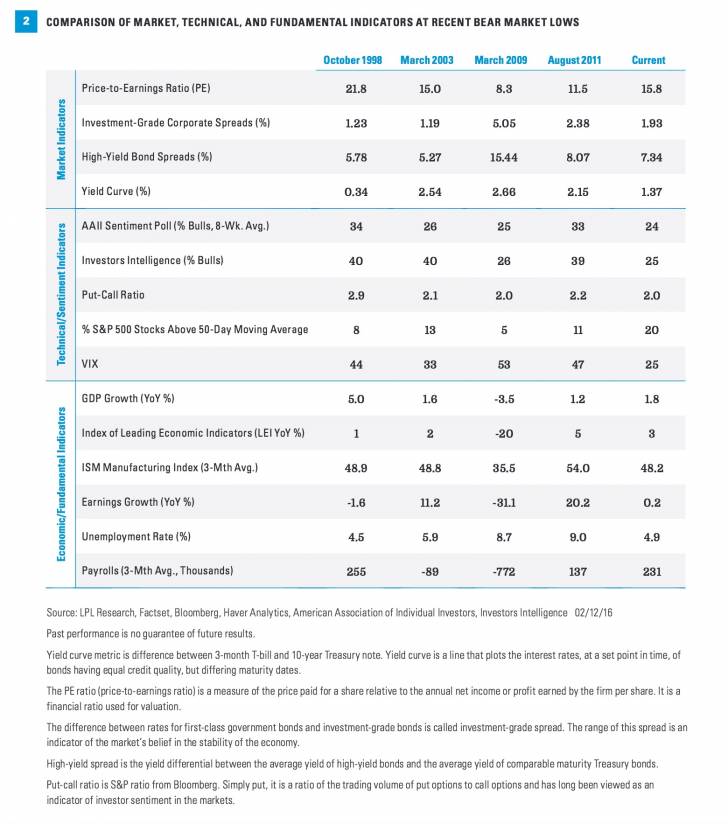
With stocks down about 9% year to date and 12.5% lower than 2015 highs (and everyone wondering where the bottom is), we compare technical, sentiment, and fundamental indicators today to levels at prior bear market lows to assess the likelihood stocks may have bottomed. Generally, these indicators provide some comfort that the sell-off may be near its end and highlight relatively better fundamentals [Figure 2].
Market-based indicators suggest bonds have priced in more bad news than stocks. Credit spreads are wider than they were at the October 1998 and March 2003 stock market lows, and close to August 2011 spreads, even though stocks have not corrected as much as they did in August 2011. But stock valuations are well above 2009 and 2011 troughs, and in-line with the March 2003 lows. On the surface, these comparisons suggest more potential near-term downside for stocks; however, given the economic cycle is in its latter stages, we think stock valuations are fair, and envision a scenario where credit markets may stabilize before stocks begin a sustained move higher.
Sentiment and technical measures show the bulls have been largely washed out. Stock market bulls have become extremely scarce. Based on two popular investor surveys (American Association of Individual Investors [AAII] and Investors Intelligence), bulls are as rare as they were at the March 2009 lows. Extreme levels of pessimism have historically provided accurate signals of market bottoms. The VIX measure of stock market volatility is calmer than we would expect, suggesting perhaps more volatility is needed to wash out more bulls; however, we could also interpret this to mean that markets were already positioned defensively coming into the year. Sentiment in the options market is similarly negative compared with levels at these prior major lows.
Fundamental picture offers some encouraging signs. Fundamentally, the current economic environment compares favorably to the last three major lows. Although this economic expansion has been lackluster, we continue to forecast 2.5% gross domestic product (GDP) growth in 2016. Leading indicators are supportive, job gains have been steady, and the service economy remains healthy (case in point: Friday’s strong January retail sales report, pushing total sales to an all-time high). All of this suggests, in our opinion, that the U.S. economy should avoid recession, and hopefully, help the S&P 500 avoid a bear market. The lack of earnings growth is concerning, as is the related softness in the Institute for Supply Management (ISM) Purchasing Managers’ Index (PMI). These indicators are at levels consistent with prior bear market lows and mild recessions, and also suggest stocks may have a bit more downside.
Putting this all together, stocks may have some more downside; but if so, we see perhaps a further decline of 5% rather than 10%. That said, we cannot completely discount the possibility that the S&P 500 finds an eventual intermediate-term bottom near 1820 depending on catalysts that may emerge.
WHAT MIGHT TURN STOCKS AROUND
We see potential for stocks to get a boost from the following potential catalysts, although admittedly timing is very difficult to predict:
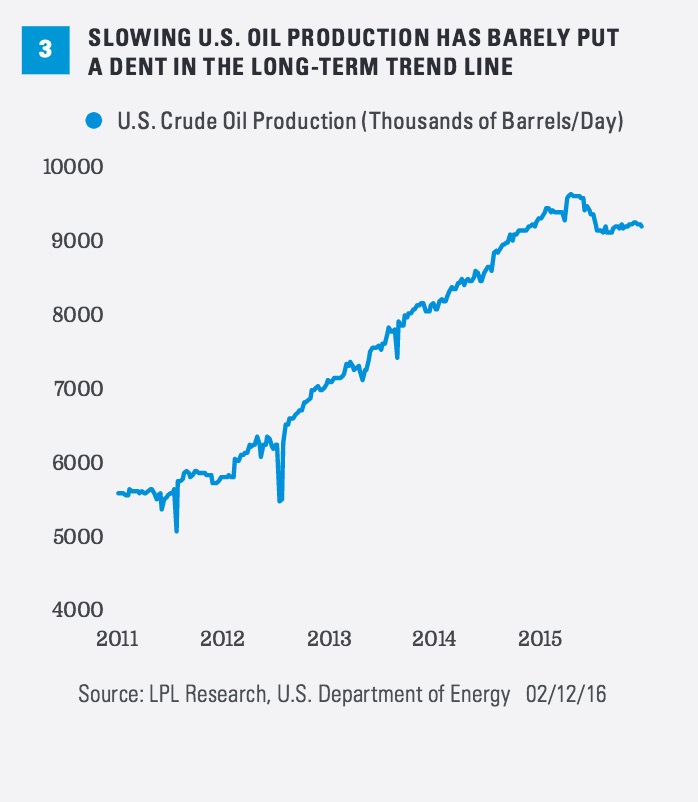
Oil price stability. Stocks have become increasingly tied to oil, making oil prices a potential catalyst for stocks. For example, on Friday (February 12), speculation of an OPEC agreement to cut supply helped drive oil up 12% (no, that is not a typo), the biggest one-day jump since 2009, which helped drive Friday’s 2% rally in stocks. Default fears in the energy sector remain a big concern for both equity and credit investors. Cuts to capital spending by oil producers have reverberated through the manufacturing industry and industrials sector (capital expenditure reductions by the S&P 500 energy sector are expected to approach $50 billion in 2016 according to FactSet-tracked consensus estimates). Concerns have spread to banks, where energy loan defaults are rising. Default fears are not limited to the U.S., as counterparty risk among European banks has become a bigger concern in part due to energy lending.
What We Are Watching: More progress toward reducing U.S. production [Figure 3] to recalibrate supply and demand or Saudi production cuts.
Estimated Timetable: 2–6 months.
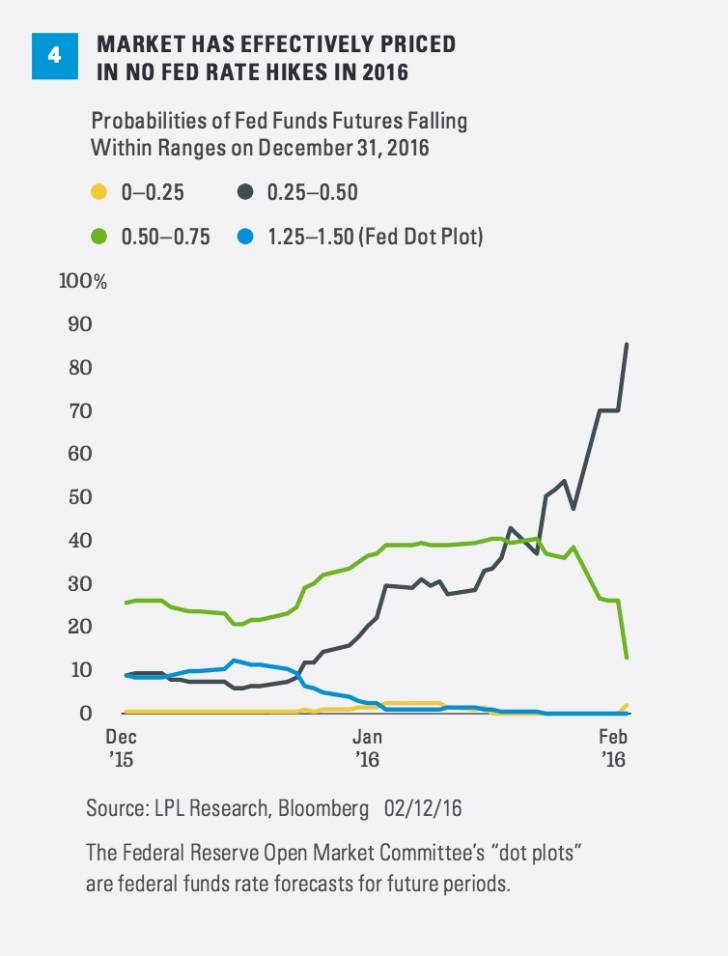
Evidence of a more pragmatic and global Fed. The Federal Reserve (Fed) appears to be more disconnected from markets than it has been in some time. Although Fed Chair Yellen has reiterated that the Federal Open Market Committee (FOMC) will be data dependent, she has given little indication that she expects less than the four rate hikes in 2016, which were conveyed in December 2015. The fed funds futures market has now effectively priced in no rate hikes at all this year [Figure 4]. The Fed and the market are seemingly too far apart for that gap to close soon; however, progress may start at the March 15–16 FOMC meeting and continue through subsequent FOMC meetings in April, June, and July.
What We Are Watching: Commentary from the Fed that closes the gap between its communications and market expectations.
Estimated Timetable: 1–5 months.
Improving credit markets. We put the odds of recession in the U.S. at about 30%. By contrast, financial markets are implying a probability closer to 50%. The energy-sensitive high-yield bond markets are sending a particularly negative signal with spreads near August 2011 levels, when markets were worried about the Eurozone breaking apart and the creditworthiness of the U.S.; they are even wider than the March 2003 bear market bottom following the 2001 recession and accounting scandals of 2002, although credit spreads had already bottomed in November 2002 and were already starting to recover.
What We Are Watching: Investment-grade and high-yield bond spreads to Treasuries. Until spreads stabilize and show progress toward sustained improvement, possibly with help from oil, the market’s recession worries may continue. The timetable for this potential catalyst is likely a bit longer because energy defaults will take time to play out should low prices continue.
Estimated Timetable: 3–12 months.
Stability in Chinese capital flows and currency. Markets remain worried about the potential for China to sharply devalue its currency (the yuan), sparking Asian currency wars similar to 1998 when the Thai baht collapsed. China’s foreign currency reserves have been falling by about $100 billion per month in recent months, largely because the central bank has been defending the yuan in the unregulated “offshore” market, although the Chinese central bank still has approximately $3.2 trillion in currency reserves. Until the market gets comfortable with the outlook for the yuan, which may be helped by better performance by the Chinese economy and a more dovish Fed, it may be difficult for U.S. stocks to sustain a meaningful rally.
What We Are Watching: Slowing Chinese capital outflows and controlled devaluation that leads to stability in the yuan currency.
Estimated Timetable: 3–12 months.
CONCLUSION
After one of the worst starts to a year for stocks, we do see some cause for optimism. Based on how stocks have historically performed after similarly bad starts to a year, the worst may be behind us. A comparison of market, sentiment, technical, and fundamental indicators to prior bear market lows provides some encouraging signs. And finally, we do see several potential catalysts that could help stocks over the next several months. Although recession odds have risen, a bear market may not necessarily be in the cards.
Thank you to Ryan Detrick for his contributions to this report.
IMPORTANT DISCLOSURES
The opinions voiced in this material are for general information only and are not intended to provide specific advice or recommendations for any individual. To determine which investment(s) may be appropriate for you, consult your financial advisor prior to investing. All performance referenced is historical and is no guarantee of future results.
The economic forecasts set forth in the presentation may not develop as predicted and there can be no guarantee that strategies promoted will be successful.
Investing in stock includes numerous specific risks including: the fluctuation of dividend, loss of principal, and potential liquidity of the investment in a falling market.
All investing involves risk including loss of principal.
Because of its narrow focus, sector investing will be subject to greater volatility than investing more broadly across many sectors and companies.
Corporate bonds are considered higher risk than government bonds but normally offer a higher yield and are subject to market, interest rate, and credit risk as well as additional risks based on the quality of issuer coupon rate, price, yield, maturity, and redemption features.
High-yield/junk bonds (grade BB or below) are not investment grade securities, and are subject to higher interest rate, credit, and liquidity risks than those graded BBB and above. They generally should be part of a diversified portfolio for sophisticated investors.
Government bonds and Treasury bills are guaranteed by the US government as to the timely payment of principal and interest and, if held to maturity, offer a fixed rate of return and fixed principal value.
Gross domestic product (GDP) is the monetary value of all the finished goods and services produced within a country's borders in a specific time period, though GDP is usually calculated on an annual basis. It includes all of private and public consumption, government outlays, investments, and exports less imports that occur within a defined territory.
The credit spread is the yield the corporate bonds less the yield on comparable maturity Treasury debt. This is a market-based estimate of the amount of fear in the bond market. Bass-rated bonds are the lowest quality bonds that are considered investment grade, rather than high yield. They best reflect the stresses across the quality spectrum
INDEX DESCRIPTIONS
The Standard & Poor’s 500 Index is a capitalization-weighted index of 500 stocks designed to measure performance of the broad domestic economy through changes in the aggregate market value of 500 stocks representing all major industries.
The Institute for Supply Management (ISM) Index is based on surveys of more than 300 manufacturing firms by the Institute of Supply Management. The ISM Manufacturing Index monitors employment, production inventories, new orders, and supplier deliveries. A composite diffusion index is created that monitors conditions in national manufacturing based on the data from these surveys.
The Index of Leading Economic Indicators is a monthly publication from the Conference Board that attempts to predict future movements in the economy based on a composite of 10 economic indicators whose changes tend to precede changes in the overall economy.
The VIX is a measure of the volatility implied in the prices of options contracts for the S&P 500. It is a market-based estimate of future volatility. When sentiment reaches one extreme or the other, the market typically reverses course. While this is not necessarily predictive, it does measure the current degree of fear present in the stock market.