
For this week’s edition of the Equity Leaders Weekly, we are going reexamine the USDCAD relationship and have a look at the current run in Gold during these volatile markets.
United States Dollar/Canadian Dollar (USDCAD)
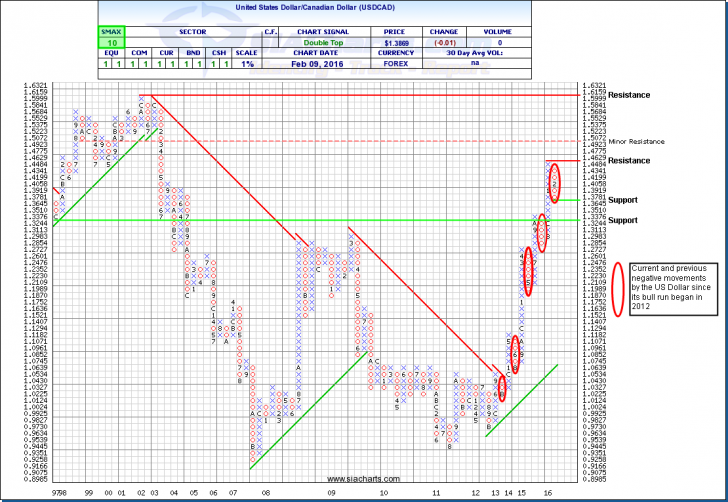
In case you missed the SIA Feature of the Week last Thursday, we are going to summarize some of the points made regarding the recent pullback in the US Dollar vs. Canada:
For those holding cash or cash equivalents denominated in US dollars, the recent pull back for many has been troubling. Looking at the relative strength of the currency, the long-term trend line, and following our process, this short term movement is not cause for panic. One of the advantages of point and figure charting and relative strength is the ability to eliminate some of the short term noise in the market and identify longer term trends.
We can see in the chart that the run up in the U.S. Dollar (USD) vs. the Canadian Dollar (CAD) has been nothing but parabolic since 2012. This movement though, has not been straight up in manner, with 4 corrections before the current pull back. Had our analysis during any of these events moved us away from the USD we would have subsequently missed enormous opportunity and our mandates performance would have been significantly less than what it was over the last 3 years.
So what do we see going forward? We see continued intermediate term outperformance of the USD over the CAD. Technically, the chart is bullish with a strong SMAX (our individual investment analysis indicator) and we have yet to move through our first support level, at 1.3645.
Our process and history shows us that the U.S. Dollar has been a strong ally, adding value in bullish markets, but also a good place to be when we have strong uncertainty, as we do right now.
Click on Image to Enlarge
Gold Continuous Contract (GC.F)
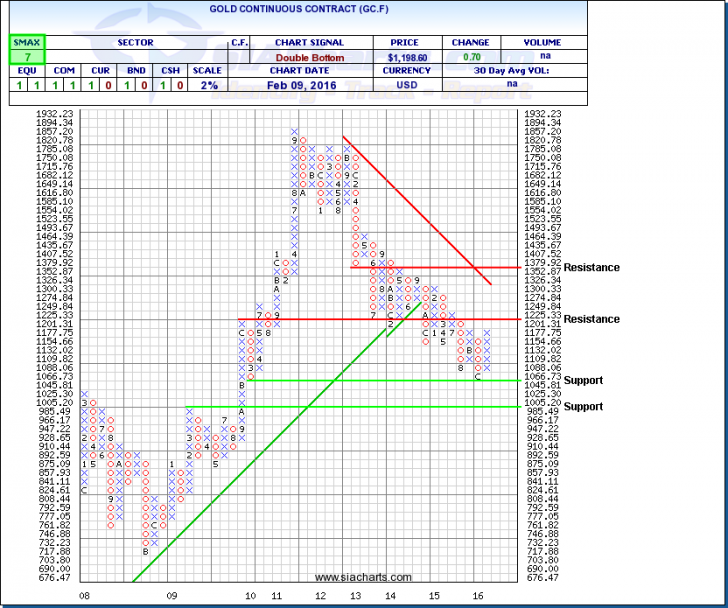
Gold, like many other commodities, may have increased volatility during periods of global and geopolitical instability with fluctuating markets. Gold is often thought as a safe haven during these times, but the volatility of this commodity as well as the many influenced equities are not for the faint of heart. Looking at some of the relative strength matrices on SIACharts.com, specifically the S&P/TSX 60 Index report we are seeing certain gold stocks up in the favored zone. In fact 8 out of the 15 names currently within the favored zone come from the Metals and Mining sector.
Gold's year-to-date run of nearly 13% has been widely discussed, but putting things in perspective, one needs only to view the chart to the right. The fact that the Gold contract held at the $1045 support level is encouraging but the metal has a long road ahead of it before investors should really start cheering. Not until a solid break through resistance at $1225 and then through its long-term downtrend line at around $1300 will we have much confidence on a major trend reversal.
As a reminder always consider the time frame for your investments and the long-term outlook of the underlying commodity when making investment decisions. A helpful hint for many advisors on this issue is to look at the historical ‘SIA R/S Matrix Position Chart’ by clicking the # rank on a report and click on the Max time frame to see the time this investment normally spends in the Favored zone to help you with an expected time frame for your potential trade. Please contact us for help on this issue as eliminating volatile stocks, sectors, or asset classes in your strategy can help decrease the amount of trades you are doing and lead to potential outperformance as well.
Click on Image to Enlarge
SIACharts.com specifically represents that it does not give investment advice or advocate the purchase or sale of any security or investment. None of the information contained in this website or document constitutes an offer to sell or the solicitation of an offer to buy any security or other investment or an offer to provide investment services of any kind. Neither SIACharts.com (FundCharts Inc.) nor its third party content providers shall be liable for any errors, inaccuracies or delays in content, or for any actions taken in reliance thereon.
For a more in-depth analysis on the relative strength of the equity markets, bonds, commodities, currencies, etc. or for more information on SIACharts.com, you can contact our customer support at 1-877-668-1332 orsiateam@siacharts.com.