O Value, Where Art Thou?
by
It’s been 15 years since the Coen Brothers’ Oscar-nominated film O Brother, Where Art Thou? was released. Loosely based on Homer’s The Odyssey, the satirical tale follows three escaped convicts as they run from the law in search of buried treasure.
For nearly the same length of time, value stocks — those bargain-priced shares which often pay higher dividends — have underperformed growth stocks. As a result, investors who favor value stocks must certainly feel like they are on an unrewarding investment odyssey of their own.
How can this be? Aren’t value stocks supposed to deliver higher returns than growth stocks?
Yes, in theory. Academics have long argued that investors should rationally expect to be compensated for the risk of owning stocks. The higher a company’s perceived risk, the higher a rate of return investors expect. In demanding higher returns, investors pay lower prices for a company’s stock, relative to its earnings, cash flow, or other fundamental measure. Paying lower prices, the theory goes, paves the way for higher future returns.
Historically, evidence supports this theory. Since 1927, large-cap value stocks in the United States have returned 11.1% per year, while large-cap growth stocks have delivered 9.4%. Among small caps, the performance advantage of value has been even greater. Small-cap value stocks have returned 14% per year while their growth counterparts have returned 9.2%.1
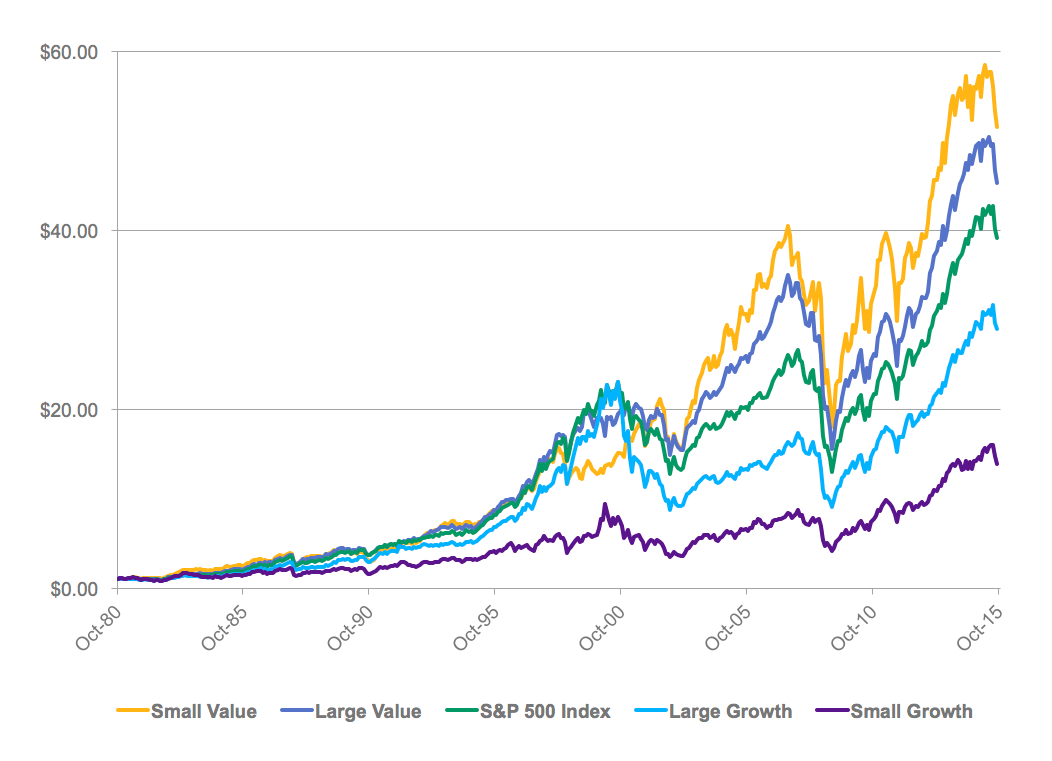
Compounded over the past 35 years, this “value advantage” in small caps would have led to nearly a four-fold difference in the ending value of $1, as illustrated below.2
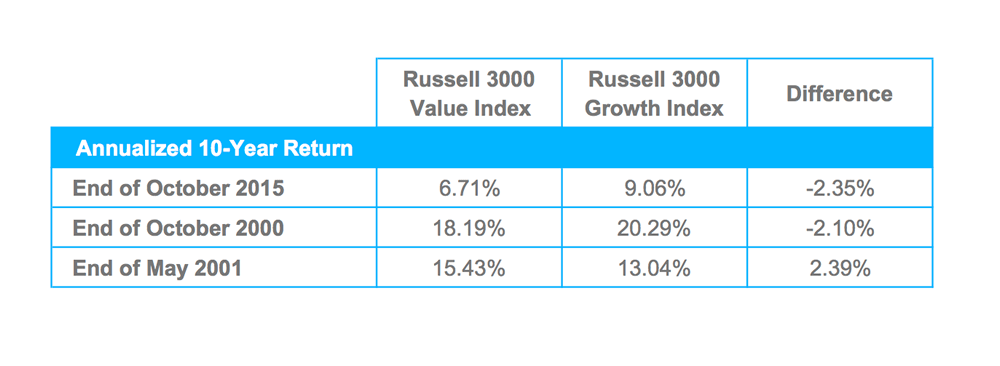
Recently, however, this has not been the case. Value stocks have underperformed growth stocks in dramatic fashion. Over the past 10 years, for example, value stocks in the United States have returned less than 7% per year, while growth stocks have returned just north of 9% per year.3 Globally, value stocks have underperformed in similar fashion.
O value, where art thou? Should this prolonged absence of a premium cause investors to now question the value of value stocks?
Hardly. A “disappearing” value premium, even over a 10-year stretch, is nothing new. In fact, since the late 1970s, 27% of all rolling 10-year periods have seen a negative value premium.4 Actually, if at any point in the past 35 years you evaluated the performance of equities over the previous decade, nearly 30% of the time you would have found that growth stocks outpaced value stocks.
Even the steeliest of investors may lack the emotional fortitude to cling to a concentrated strategy that can remain out of favor for so long.
This is just one of the reasons why a properly-diversified stock portfolio includes not only value stocks, but small-cap and growth stocks, publicly-traded REITs, as well as developed- and emerging-market international stocks. Indeed, such a value-oriented, diversified portfolio still managed to reward investors over the past decade, despite a predominantly negative value premium.5
Ironically, it is this uncertain investment journey in the absence of the value premium which may set the stage for its eventual return. As returns languish, prices fall and the opportunity for disciplined investors to earn the premium is restored.
This reversal of fortune can be swift and unexpected, as in O Brother, Where Art Thou? Near the end of the film, the convicts are set to be hanged by the sheriff, only to be saved by the bursting of a dam that floods their immediate surrounding. Similarly, markets can shift in an instant and the value premium can return with force.
Consider, for example, the decade that ended in October 2000. Growth stocks in the United States had outperformed value stocks by 2.1% per year over the preceding 10 years. Yet just seven months later, a look in the rearview mirror provided a completely different picture of trailing 10-year performance: Value stocks had outperformed growth stocks by 2.4% annually.6
How did that happen? Remarkably, in the five months from November 2000 to March 2001, value stocks outpaced growth stocks by a whopping 35%. In other words, we should be careful about extrapolating the recent past into the future — both can change quickly!
If you liked this post, don’t forget to subscribe to the Enterprising Investor.
1. January 1927 through December 2014; Fama/French Indices, with utilities.
2. Growth of $1, October 1985 through October 2015, Russell 1000 Value and Growth Indices for large cap; Russell 2000 Value and Growth Indices for small cap.
3. November 2005 through October 2015; Russell 3000 Value and Growth Indices.
4. 10-year annualized performance difference, Russell 3000 Value Index minus Russell 3000 Growth Index.
5. For example, from November 2005 through October 2015, a market-weighted global portfolio as measured by the MSCI ACWI Index (USD) returned 6.2% per year. Over the same period, the following hypothetical value-oriented global portfolio returned 7.2% per year: 30% Russell 1000 Value Index, 15% Russell 1000 Growth Index, 10% Russell 2000 Value Index, 5% Russell 2000 Growth Index; 10% Dow Jones US Select REIT Index; 10% MSCI EAFE Value Index, 5% MSCI EAFE Growth Index, 5% MSCI EAFE Small Cap Index, 6% MSCI Emerging Markets Index, 2% MSCI Emerging Markets Small Cap Index, and 2% MSCI Emerging Markets Value Index. All international indices are gross dividends.
6. November 1990 through October 2000, and June 1991 through May 2001; Russell 3000 Value and Growth Indices.
Please note that the content of this site should not be construed as investment advice, nor do the opinions expressed necessarily reflect the views of CFA Institute.
Image credit: ©iStockphoto.com/rogistok
Copyright ©


