
KEY TAKEAWAYS
- The Russell 2000 Index hit a fresh all-time high last week (on tax day, April 15, 2015) and has outpaced large caps by 205 basis points (2.05%) year to date.
- Although valuations are on the high side, the factors that have driven recent small cap strength, in our view, remain largely intact.
- Small cap technicals appear bullish, with positive relative strength and an upward sloping 40-week moving average.
 Sizing Up Small Caps
by Burt White, Chief Investment Officer, LPL Financial
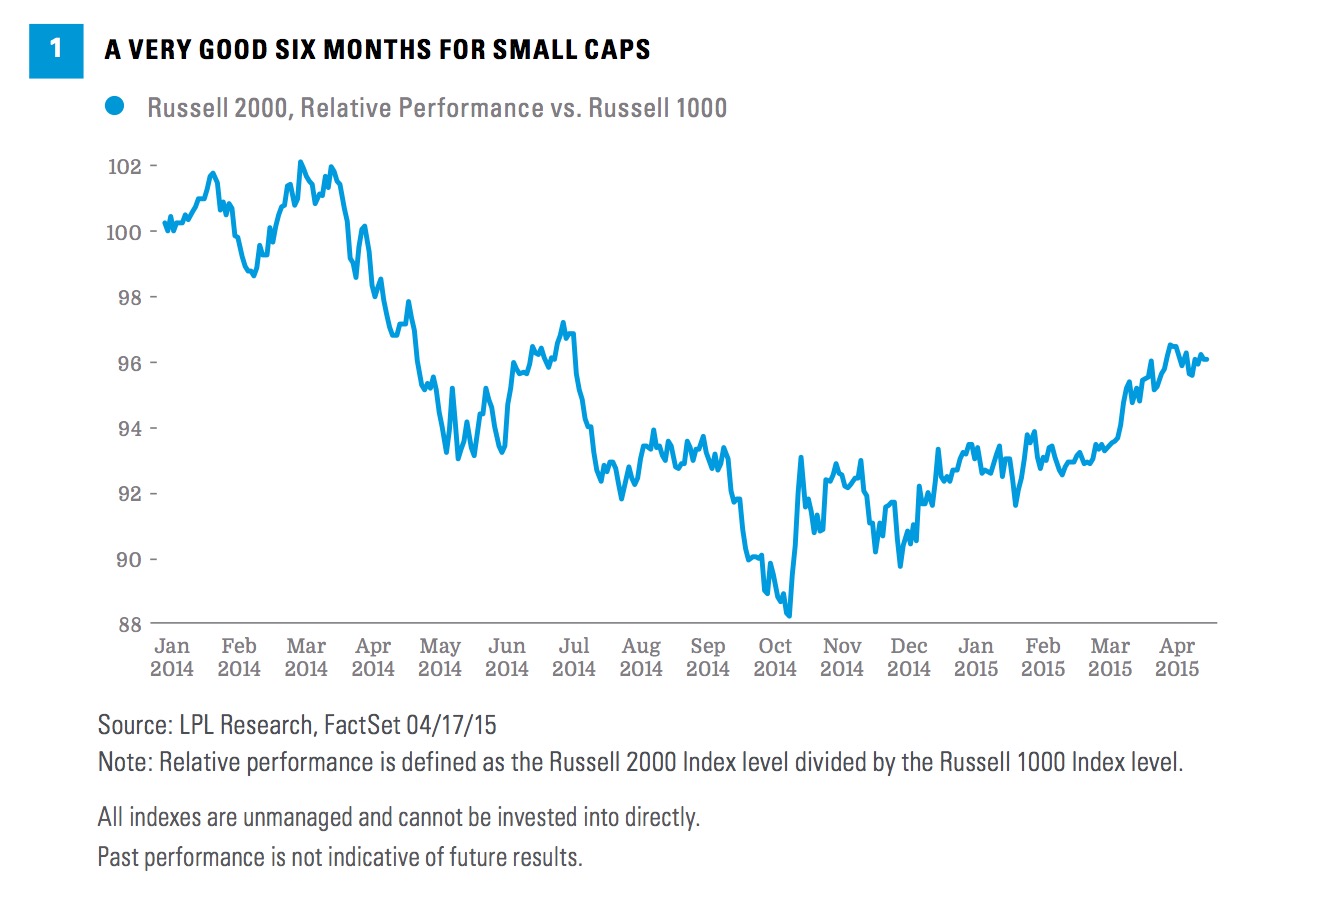
Small caps have had a very strong start to 2015. The small cap Russell 2000 Index hit a fresh all-time high last week (on tax day, April 15, 2015) and has outpaced large caps by 205 basis points (2.05%) year to date. This year’s strength follows a strong
Small caps have had a very strong start to 2015. The small cap Russell 2000 Index hit a fresh all-time high last week (on tax day, April 15, 2015) and has outpaced large caps by 205 basis points (2.05%) year to date. This year’s strength follows a strong fourth quarter rally when the Russell 2000 Index rose 9%, outpacing the large cap Russell 1000 Index by 5 percentage points [Figure 1]. Here we look at the drivers of this strength and discuss our small cap outlook.
Small cap stocks may be subject to a higher degree of risk than more established companies’ securities. The illiquidity of the small cap market may adversely affect the value of these investments.
DRIVERS OF RECENT STRENGTH
After material underperformance throughout much of 2014, since October 2014, small caps have staged a solid comeback. We attribute the rebound to a number of factors:
Equity market sensitivity (beta). In general, when the broad stock market rises, small cap stocks tend to capture a larger share of those gains than large caps. Since September 30, 2014, which roughly marks the start of the reversal in small cap performance, the all cap Russell 3000 Index is up 7%, the Russell 2000 Index is up 13.8%, and the large cap Russell 1000 Index is up just 6%.
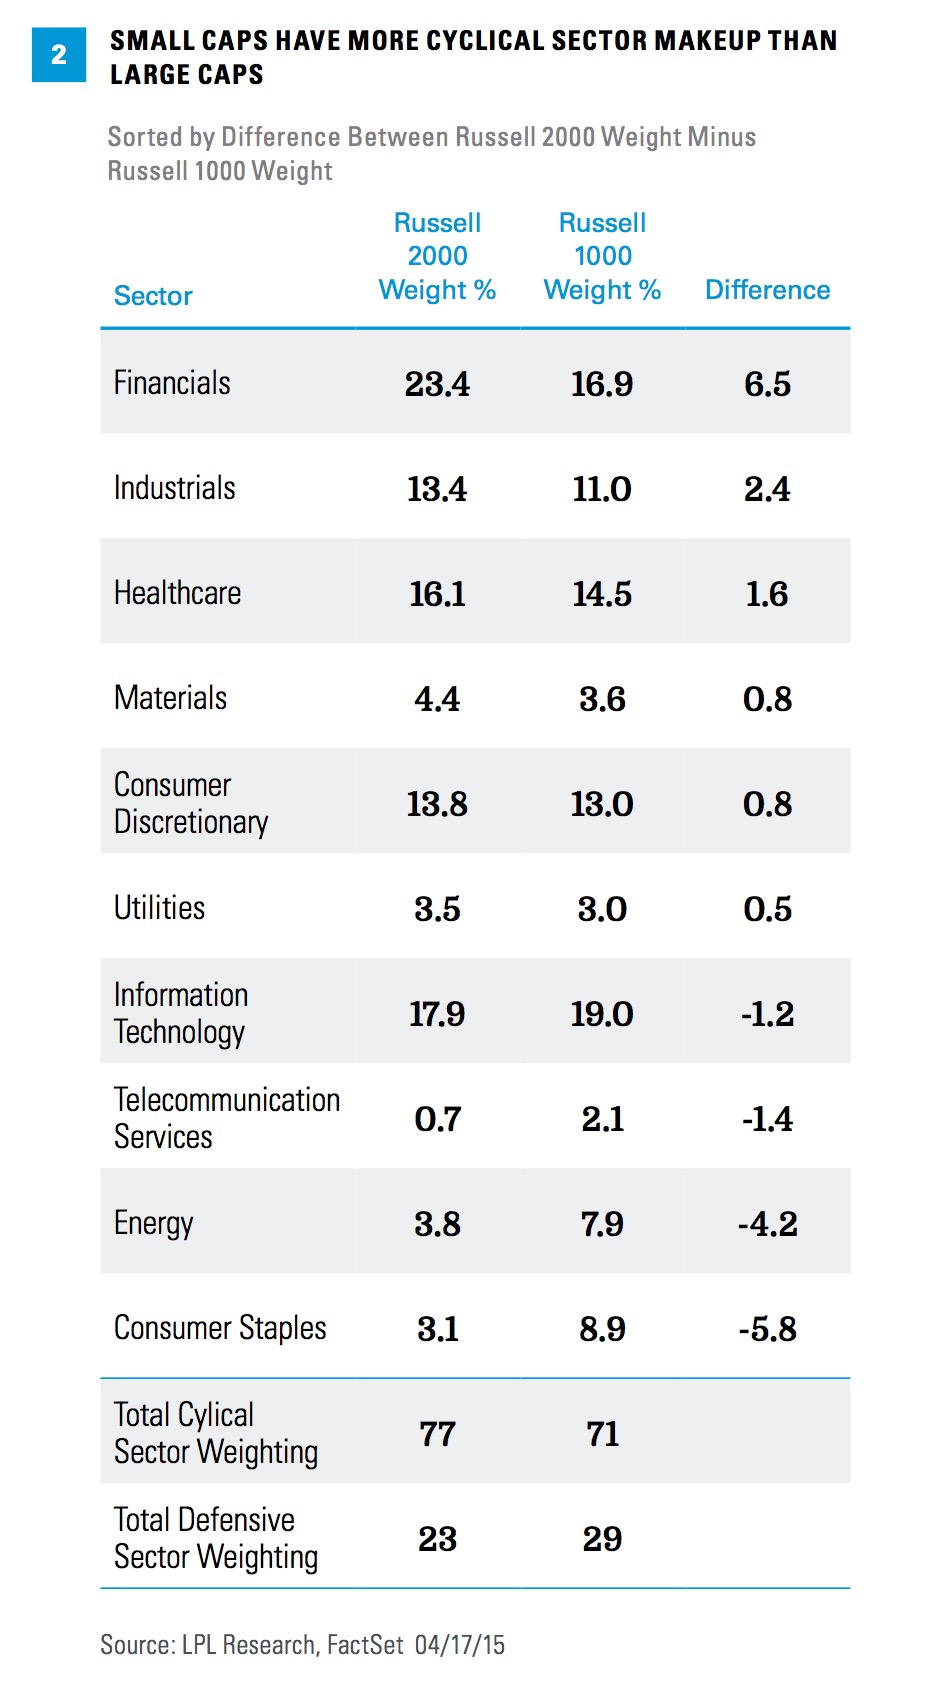
Improved performance of cyclical stocks. The Russell 2000 Index includes a 77% weighting in cyclical sectors (consumer discretionary, energy, industrials, materials, technology, and financials), compared with 71% for the Russell 1000 Index [Figure 2]. Accordingly, when cyclical sectors outperform defensives, which tends to correspond to a rising broad stock market, small cap’s relative performance has historically been better.
Strong U.S. dollar. Small cap companies tend to earn less of their revenue overseas in foreign currencies; as a result, the strong dollar is less of a drag on small cap profits than large cap. The U.S. Dollar Index (based on the DXY Index, representing a basket of foreign currencies) is up 8% year to date (through April 17, 2015) following last year’s 13% gain. We estimate that the Russell 2000 Index may generate about 20 – 25% of revenue overseas, compared with 35 – 40% for the large cap Russell 1000 Index.
Smaller energy drag. Less exposure to energy has been a boon for small cap relative performance in recent months, although this factor has begun to reverse in recent weeks. As shown in Figure 2, the energy sector composes just 3.8% of the Russell 2000 Index, compared with more than double that (7.9%) for the large cap Russell 1000 Index. During the fourth quarter of 2014 and first quarter of 2015 combined, the S&P 500 Energy Index underperformed the S&P 500 Index by more than 17 percentage points. Since March 31, 2015, the energy sector has outperformed the S&P 500 Index by about 100 basis points (1%).
Improving credit markets. Small cap companies tend to require more access to credit markets to fund their businesses, compared with large cap companies with their typically stronger balance sheets. Accordingly, when credit markets are healthy or improving, small cap stocks have performed well. Improving credit market environments also tend to correspond with rising equity markets, which also favor small caps as discussed above. Easing fears of a wave of energy company defaults have led to improved performance of investment grade and high-yield bonds since mid-December 2014.
Merger and acquisition activity. Small (and mid) cap stocks have performed better during healthy merger and acquisition environments. Many mergers involve large cap companies acquiring smaller companies at premiums, something we’ve seen a lot of recently in the pharmaceutical and biotech areas. During the 12 months ending March 31, 2015, the total number of acquisitions increased by 19%, compared with the 12-month period ending March 31, 2014, according to FactSet. The dollar value increase in mergers over this period is a much larger 48%.
SOME CONCERNS
We expect 2015 to mark the beginning of a transition to large cap leadership as the economic expansion moves into its latter stages, as noted in our Portfolio Compass publication. With the bull market in its seventh year (third longest since World War II) and the economic expansion about to hit its sixth birthday, we believe the midpoint of the cycle has passed. As 2016 approaches, it is reasonable to assume the cycle will be in its latter third. As a result, we may potentially become more cautious on small caps as this year progresses.
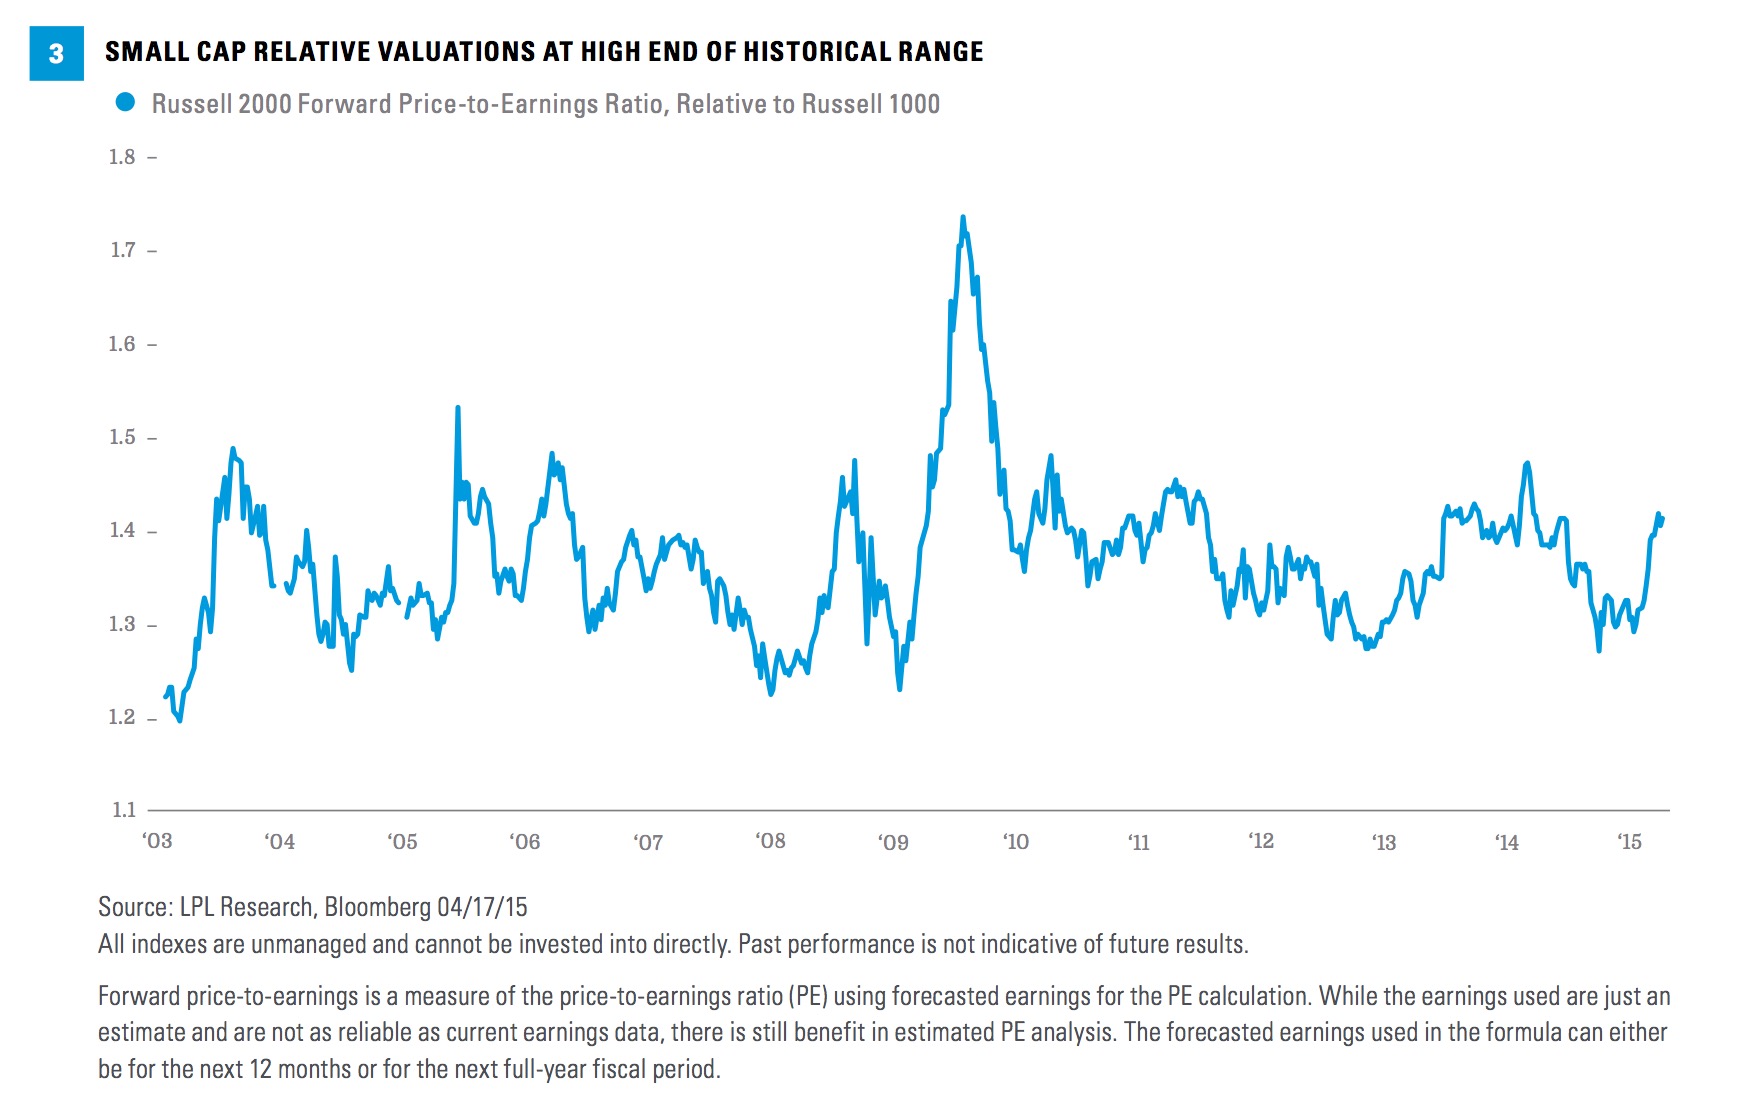
Our other primary concern is valuations. Figure 3 shows that on a forward price-to-earnings ratio (PE) basis, the Russell 2000 Index is trading at a 40% premium to the Russell 1000 Index. Add in that large cap PE ratios are above their long-term averages and small cap stock valuations are on the high side. The Russell 2000 Index is, however, expected to deliver faster earnings growth than the large cap indexes in 2015 based on FactSet consensus estimates.
SMALL CAP TECHNICALS APPEAR BULLISH
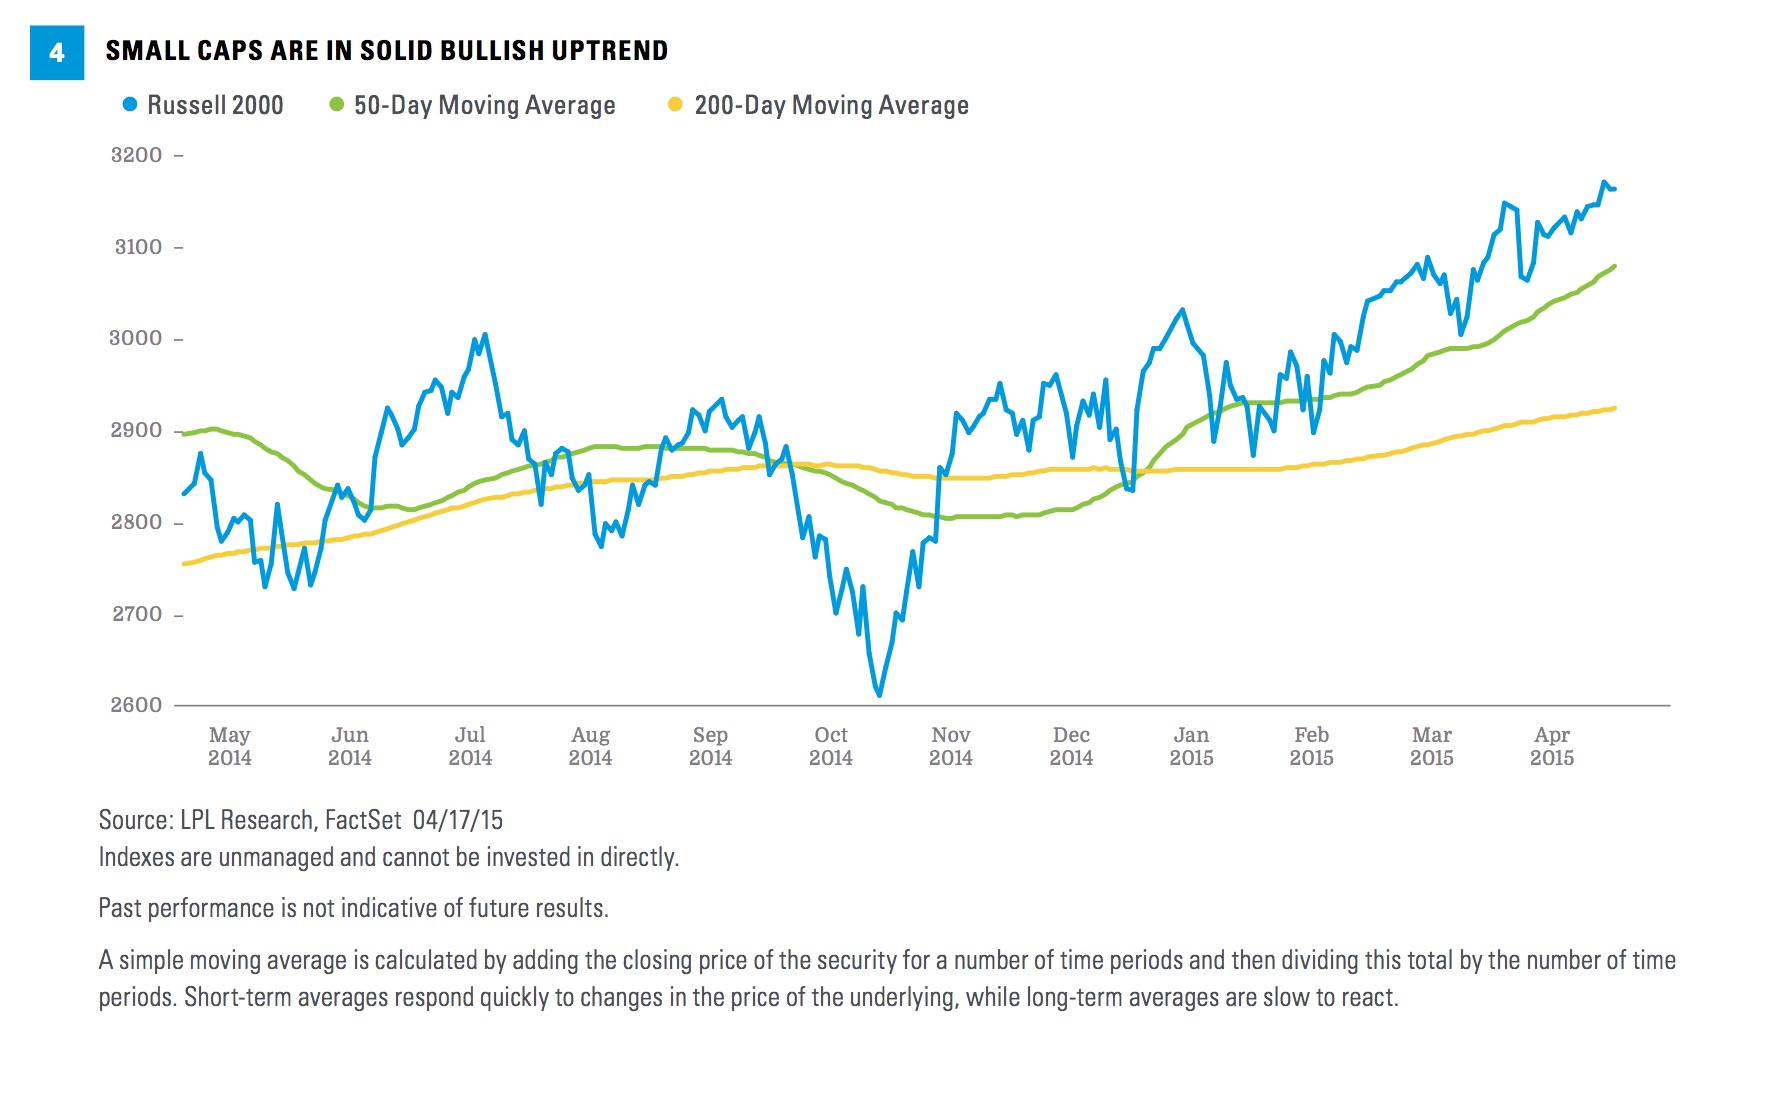
Small caps appear bullish from a technical analysis perspective. Relative strength is in a solid uptrend, as shown in Figure 1. And the Russell 2000 Index absolute chart [Figure 4] is showing a weekly bullish trend, as exhibited by a positively sloping 40-week simple moving average (SMA). As long as the Russell 2000 Index price remains above its 40-week SMA, then we believe the moving average should remain positively sloping, which supports a long-term bullish price trend.
CONCLUSION
Small caps have had a nice run since last fall that may continue. Although valuations are on the high side, the economic cycle is in its latter stages, and we may be due for more market volatility, we expect a continuation of recent trends that have helped small caps: a (gradually) rising broad stock market, cyclical sector outperformance, a strong U.S. dollar, a favorable credit market environment, and healthy merger activity.
****