


by Burt White, CIO, and Jeff Buchbinder, Market Strategist, LPL Financial
Thanks to some help from the Greece agreement reached Friday afternoon (February 20, 2015), the S&P 500 and Dow Jones Industrials Average ended last week at new record highs, while the NASDAQ has moved to within 50 points of the 5000 milestone.
The market’s continued ascent has caused some to ask if the stock market reflects excessive optimism. One way to respond to that question is to look at valuations. On both trailing earnings and forward earnings estimates, we believe price-to-earnings (PE) ratios – both between 17 and 18 – are slightly rich, but not high enough for us to change our positive outlook for U.S. stocks for 2015. (For more on our 2015 stock market forecasts, please see our Outlook 2015: In Transit publication.) Another way to gauge optimism is to look at market surveys, such as the percentage of bulls from the American Association of Individual Investors (AAII), which at 72% is only slightly above the long-term average range of 60 – 65% and not excessively optimistic. Finally, earnings and economic surprises also indicate that investor expectations remain reasonable.
WHAT CAN THE CESI TELL US ABOUT THE STOCK MARKET?
Economic data in the United States have been missing expectations more often than exceeding them in recent weeks, suggesting expectations have been pulled down as stocks reached new highs. The Citigroup Economic Surprise Index, or CESI, tracks how the economic data are faring compared with expectations. The index rises when economic data exceed economists’ consensus estimates and falls when data are below estimates. The index’s most recent reading of -48 marks its worst level in 2.5 years, well below the 10-year average (+2.8), and near levels where a reversal would typically come. The index has been dragged down by several factors, including the energy downturn, the West Coast port shutdowns, sluggish growth overseas, and the strong U.S. dollar.
For example, among the reasons cited for the shortfall in the Institute for Supply Management Manufacturing Index for January (53.5 versus 54.5 expected) included the impact of lower oil prices on manufacturers, the export drag from a strong U.S. dollar, and sluggish growth overseas. Economic forecasts do not appear to reflect excessive optimism, even as stocks power to new highs. So what does the CESI mean for the stock market? When economic data are missing expectations, i.e., when the CESI is negative or falling, one would expect stocks to fall, or at least gain less; and that is indeed the case. But factors such as the data’s time lag, the forward-looking nature of the market, and shifting expectations combine to make the CESI a less effective leading indicator of stock market performance: When the CESI is above zero, the S&P 500 is up 74% of the time over the next three months, with an average gain of 1.9% (based on the past 10 years of data). When the CESI is below zero, the S&P 500 is still up 63% of the time over the next three months, with an average gain of 1.7%.
A look at a rising versus falling CESI as a stock market signal yields slightly better results, but is still not compelling.
Does that mean this index cannot be useful for stock investors as a gauge of expectations? Although the CESI has not been a great broad stock market signal, its movement has closely followed the market’s sector preferences. The relationship between the CESI and the relative performance of cyclical sectors compared with their defensive counterparts has been tight in recent years
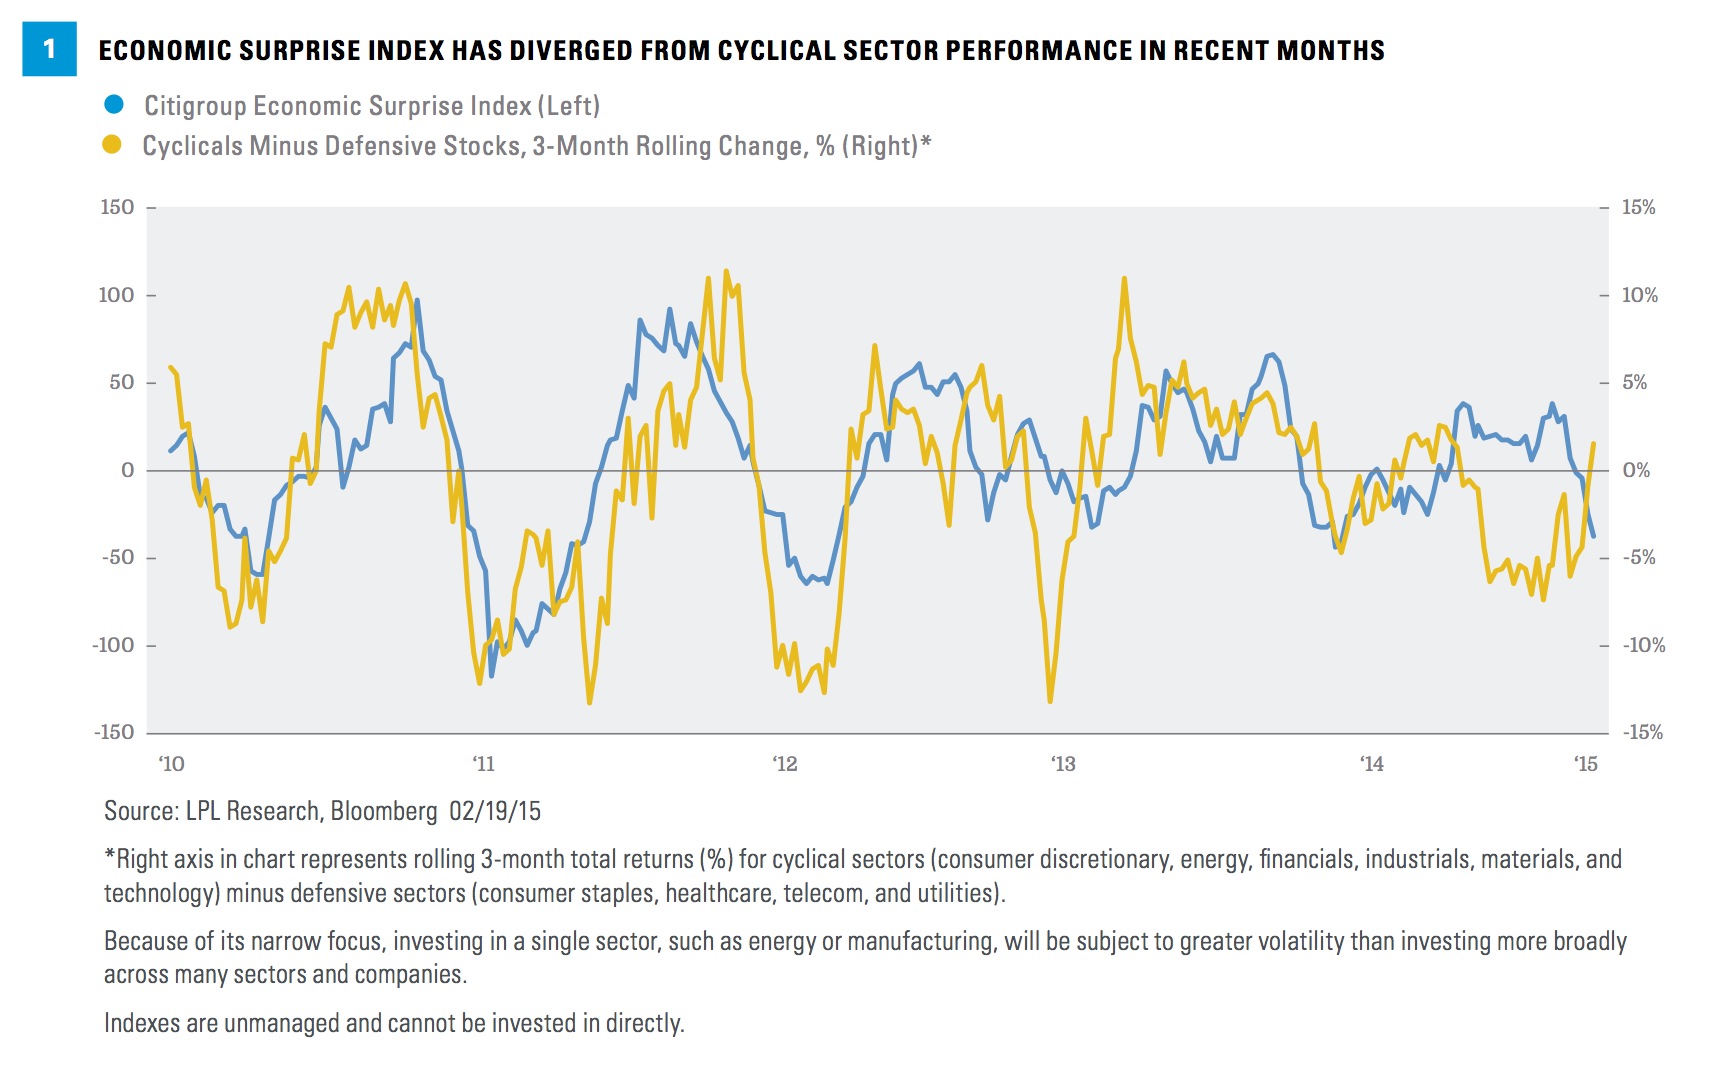
. When economic data are better than expected, the market has favored more economically sensitive, i.e., cyclical investments; if the data are worse than expected, then the market has favored more defensive investments. This makes sense because of the data’s impact on economic growth and earnings estimates, and the likelihood that weaker data would push interest rates down makes defensive sectors’ higher yields more attractive (think utilities).
However, as shown in Figure 1, the drop in the CESI since September 2014 has coincided with outperformance of cyclical sectors, not defensives, as this pattern might suggest. There are several possible explanations for this. The market may be discounting recent disappointments because of temporary drivers of the weakness (weather, port shutdowns, plummeting oil prices). We only have to look back a year ago for a case where economic data snapped back following a disruptive winter. A relatively swift resolution of the labor dispute that led to the West Coast port shutdowns had been anticipated, and indeed came over the weekend of February 21–22, 2015. Market participants may be discounting the impact of the oil downturn due to expectations of higher prices later in the year and the ongoing benefits of cheaper oil/fuel for consumers and corporations. Better news from Europe may also be a factor, as the market anticipated the Greece resolution and reacted to better than expected economic data there (the CESI for Europe has been rising and is well above zero).
We continue to favor the cyclical sectors broadly, with an emphasis on the consumer discretionary, industrials, and technology sectors. The only defensive sector where our view is positive is healthcare.
EARNINGS EXPECTATIONS ALSO REASONABLE
Another way to gauge expectations is by looking at the percentages of companies beating earnings and revenue forecasts (so-called “beat rates”) and revisions to future estimates. Fourth quarter 2014 results have beaten earnings expectations at a solid clip, while guidance has delivered the typical conservatism, outside of the energy sector, despite the drag on foreign-sourced profits from the strong U.S. dollar. With 88% of S&P 500 companies having reported fourth quarter 2014 results, 69% of them have exceeded forecasts, above the long-term average of 63% based on Thomson Reuters data, for a growth rate of 6.6%. The beat rate for revenue is 57%, slightly below the long- term average of 61% and the average during the current economic expansion (59%), for an energy- depressed growth rate of 1.9%.
Company earnings guidance has generally been conservative, as it usually is. But excluding the dramatic cuts to energy sector estimates, the reduction in earnings estimates for 2015 of about 3% is typical. The now 2% earnings growth forecast for 2015, which could be overly pessimistic, would be about 7% and within our forecasted range of 5 – 10% (as noted in our Outlook 2015 publication), if the energy sector was excluded. So while fourth quarter earnings growth rates are not particularly strong, it is hard to argue that earnings expectations outside of energy reflect excessive optimism.
CONCLUSION
The pace of economic surprises as measured by the CESI suggests reasonable expectations. We view recent economic disappointments as largely temporary, and would expect the surprise index may reverse recent declines as expectations have come down, providing support for cyclical sectors. With the Dow and S&P 500 at new record highs, some measures of stock market sentiment do reflect some optimism, but we do not see it as excessive.
Read/Download the complete report below:
Weekly Market Commentary 02232015(1)
IMPORTANT DISCLOSURES
The opinions voiced in this material are for general information only and are not intended to provide specific advice or recommendations for any individual. To determine which investment(s) may be appropriate for you, consult your financial advisor prior to investing. All performance referenced is historical and is no guarantee of future results. The economic forecasts set forth in the presentation may not develop as predicted and there can be no guarantee that strategies promoted will be successful. Investing in stock includes numerous specific risks including: the fluctuation of dividend, loss of principal, and potential liquidity of the investment in a falling market.
All investing involves risk including loss of principal.
INDEX DESCRIPTIONS
The Standard & Poor’s 500 Index is a capitalization-weighted index of 500 stocks designed to measure performance of the broad domestic economy through changes in the aggregate market value of 500 stocks representing all major industries. The Citigroup Economic Surprise Index is an objective and quantitative measure of economic news. It is defined as weighted historical standard deviations of data surprises (actual releases versus Bloomberg survey median). A positive reading of the Economic Surprise Index suggests that economic releases have on balance beaten consensus. The index is calculated daily in a rolling three-month window. The Dow Jones Industrial Average (DJIA) Index is comprised of U.S.-listed stocks of companies that produce other (nontransportation and nonutility) goods and services. The Dow Jones Industrial Averages are maintained by editors of The Wall Street Journal
. While the stock selection process is somewhat subjective, a stock typically is added only if the company has an excellent reputation, demonstrates sustained growth, is of interest to a large number of investors, and accurately represents the market sectors covered by the average. The NASDAQ Composite Index measures all NASDAQ domestic and non-U.S.-based common stocks listed on the NASDAQ stock market. The index is market- value weighted. This means that each company’s security affects the index in proportion to its market value. The market value, the last sale price multiplied by total shares outstanding, is calculated throughout the trading day, and is related to the total value of the index. It is not possible to invest directly in an index. The Institute for Supply Management (ISM) Index is based on surveys of more than 300 manufacturing firms by the Institute of Supply Management. The ISM Manufacturing Index monitors employment, production inventories, new orders, and supplier deliveries. A composite diffusion index is created that monitors conditions in national manufacturing based on the data from these surveys.
DEFINITIONS
Trailing PE is the sum of a company’s price-to-earnings, calculated by taking the current stock price and dividing it by the trailing earnings per share for the past 12 months. This measure differs from forward PE, which uses earnings estimates for the next four quarters. Forward price-to-earnings is a measure of the price-to-earnings ratio (PE) using forecasted earnings for the PE calculation. While the earnings used are just an estimate and are not as reliable as current earnings data, there is still benefit in estimated PE analysis. The forecasted earnings used in the formula can either be for the next 12 months or for the next full-year fiscal period.