


For this week's SIA Equity Leaders Weekly, we are going to focus on the importance of our Macro Indicators, specifically, our SIA Asset Class Model. Using this Model we will discuss how it played a crucial role in helping us to identify the strength in the U.S. markets and at the same time the weakness in Commodities over 3 years ago. This perspective is not one that we have come to recently along with everyone else, but one that has been developing on our system since Jan. 2012.
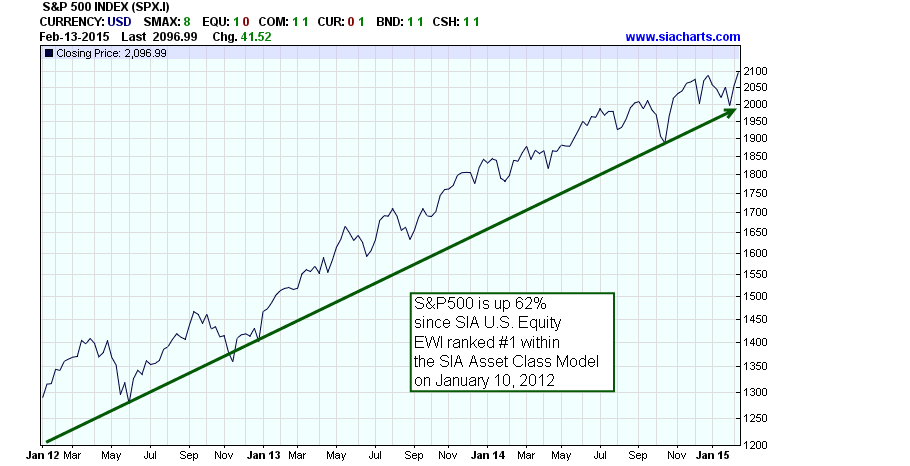
S&P 500 Index (SPX.I)
On Jan.10, 2012 our Equity Action Call moved back into the Favoured Green Zone after a brief period in the Unfavoured Red Zone in Q3/Q4 2011 due to the U.S. Debt Ceiling Crisis and the subsequent 20% decline in the markets. However, what our system was showing at this time was not just another change in the Asset Class rankings but rather a major Asset Class transition that would define the next 3 years and possibly beyond! It was time for the U.S. equity market to wake up after a decade long relative strength slumber vs Canadian equities and Commodities. We alerted our subscribers to this significant change in development within the equity markets in our Jan. 12, 2012 Equity Leaders Weekly that is available for viewing in our archived listings. In it, we stated: "The strength of the S&P500 over the S&P/TSX Composite has been going on for several months now. As of yesterday though, we also see U.S. Equities leading other asset classes ... an event that has not been seen for years. Those looking at purchasing new equity positions should be focusing primarily on the strength of the U.S. Equity Markets." We also discussed what we were seeing on the USD charts and its impact on the U.S. equity markets. In this same article, we stated: "One of the most important charts of this past year has been the U.S. Dollar Index ... we have a material reversal of fortune and now see the USD breaking its downtrend line after over a decade of decline. This positive move can only be seen as material for the USD and especially so as we see U.S. stocks rallying and becoming more and more favoured over other countries stocks ... it suggests that a new force is in play ... the new found strength in the U.S. Dollar Index and U.S. Equities could be suggesting this is a trend we could see for some time."
Over the past 3 years since Jan.10, 2012, the U.S. equity market has dominated the rankings spending 28 out of 36 months (based on month-end data) in the #1 position of the SIA Asset Class Model and 32 out of 36 months ranked higher than Canadian Equities and Commodities. The U.S. Equity markets have clearly been the big Asset Class winner over the past 3 years with a cumulative return of +62%. The SIA Asset Class Model was able to pick up the changing winds in money flows that moved out of Canadian Equities and Commodities and into U.S. Equities early on in its transition and enabled our subscribers to shift their asset allocation in favour of the U.S. equity market.
Click on Image to Enlarge
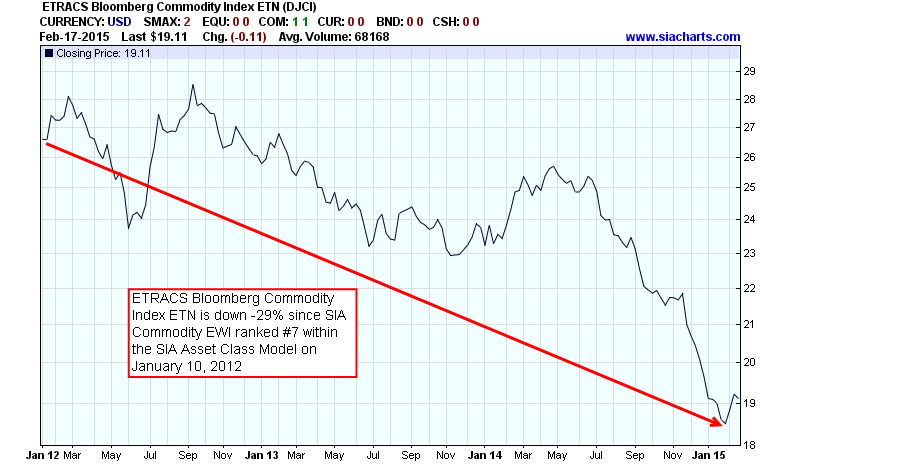
ETRACS Bloomberg Commodity Index ETN (DJCI)
At the same time the U.S. Equity market was moving up the rankings in our SIA Asset Class Model in Jan. 2012, the SIA Commodity EWI was moving down to the bottom of the list and remained there for the next 3 years and counting! After a decade long bull market in several key commodities, it was beginning to rollover and enter into a multi-year bear market. Investors had become so accustomed to rising prices in commodities like gold, silver, and crude oil that they never imagined they were entering a topping pattern and about to reverse course dramatically. Looking at specific commodities within the broader commodity universe, our subscribers would have been alerted to several key developments that warned of increasing risks that negatively impacted most clients' portfolios over the past 3 years. For example, if you were following our Equity Action Call (EAC) you would have been in Cash on Aug. 4, 2011. On Jan. 10, 2012 the EAC went back into the Favoured Zone but the SIA Commodity EWI Asset Class was ranked #7 (out of 7) on our SIA Asset Class Model and the SIA Metals & Mining EWI was ranked #30 (out of 31) on our Stock Sectors Report and so our recommendation would have been to completely avoid this asset class and sector. On Aug. 4, 2011 Gold and Silver were trading at $1659.00 and $39.43 respectively and as of Feb. 13, 2015 they were trading at $1227.10 and $17.29. Following our EAC, SIA Asset Class Model and Metals & Mining EWI would have steered you clear of a drop of -26% for Gold and -56% for Silver. At the same time our SIA Energy EWI was ranked at the bottom of the Neutral Zone on our Stock Sectors Report on Jan. 10, 2012 so our recommendation would have been to look at other sectors showing stronger relative strength. Two months later, the SIA Energy EWI dropped into the UnFavoured Zone and has remained there ever since. On Aug. 4, 2011 Crude Oil was trading at $86.63 and as of Feb.13, 2015 it was trading at $53.67. This was a drop of -38% that could have been avoided in oil.
Over the past 3 years since Jan.10, 2012, the Commodity market has shown the most weakness on our SIA Asset Class Model, spending 25 out of 36 months (based on month-end data) in the #7 position and 36 out of 36 months within the bottom 3 positions. Commodities have been the clear Asset Class loser over the past 3 years with a cumulative return of -29%. Again, the SIA Asset Class Model was able to pick up the changing tides in the Commodities markets after a decade long bull run and alert our subscribers to this transition.
Click on Image to Enlarge
SIACharts.com specifically represents that it does not give investment advice or advocate the purchase or sale of any security or investment. None of the information contained in this website or document constitutes an offer to sell or the solicitation of an offer to buy any security or other investment or an offer to provide investment services of any kind. Neither SIACharts.com (FundCharts Inc.) nor its third party content providers shall be liable for any errors, inaccuracies or delays in content, or for any actions taken in reliance thereon.
To learn more about how to utilize our Equity Action Call and SIA Asset Class Model in your investment process, please call or email us at 1-877-668-1332 or siateam@siacharts.com.
Copyright © SIACharts.com