by Vadim Zlotnikov, AllianceBernstein
Many investors think US stocks are due for a correction: They feel that the market has run too far, that the Fed has been slow to act, that complacency has created pockets of excess. Do these gut feelings mean a major equity correction looms? Not yet, in our view.
The S&P 500 Index has seen 16 one-year corrections of at least 15% since 1927. These corrections were preceded by sharp equity run-ups, and we’ve seen a comparable return streak recently. This is consistent with the intuition that equity corrections follow on the heels of excessive optimism.
Common wisdom—colored by 2007—says corrections are preceded by complacency, but this doesn’t bear out historically. Trailing volatility and asset correlations in precrisis periods—the “price” of risk—are roughly in line with historical averages. Of course, even if complacency doesn’t seem to precede corrections, that doesn’t mean it should be ignored. The take-away is that cheap capital can boost asset prices much longer than appears rational. The key in today’s market is to monitor and hedge exposure to areas of excess that are forming in the markets because of abundant liquidity and cheap risk.
A Historical Perspective
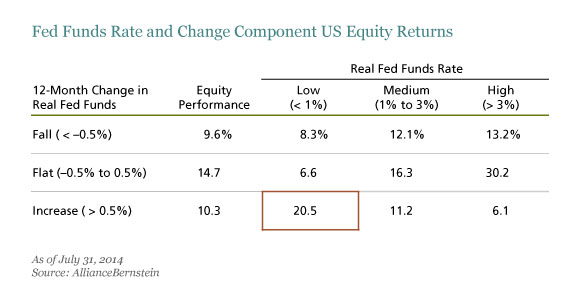
Almost every economic recession since 1950 followed a flat or inverted yield curve, and most equity corrections have followed a flattening yield-curve slope. The current yield curve is still very steep in historical terms, but the recent flattening is consistent with fears that the Fed is slow to respond—and that the eventual withdrawal of liquidity will hurt economic growth. The big issue is timing: equity markets generally rally early in rate-hike cycles and decline only after interest-rate policy is viewed as hurting future growth. When rates rise from very low levels, equity returns are actually strongest (Display).
What about the most obvious indicators of an equity correction: earnings and valuations?
Surprisingly, earnings per share fell in just over half of the market corrections since 1950. This is at odds with many investors’ views, which are anchored in the last two corrections, 2000–2001 and 2008. Those corrections happened during recessions, and were extreme in the context of earnings declines at the time.
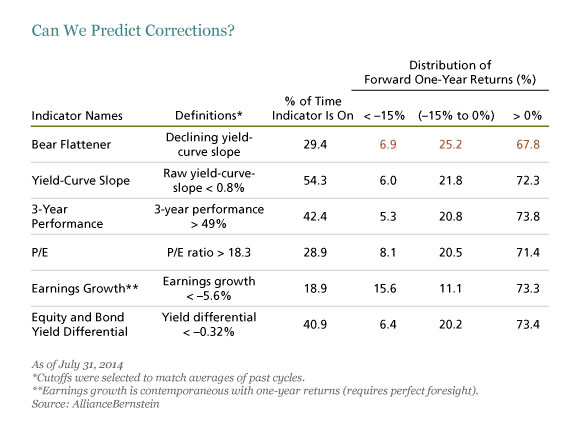
As for valuations, price/earnings ratios just prior to corrections tend to be elevated (an average of 18.3 historically), and the ratio at the end of July (17.9) was near that level, which could be a cause for concern. But another well-recognized valuation measure doesn’t appear to signal trouble: the yield difference between stocks and bonds is 3% today, much higher than the precorrection average of –0.3%. This supports the often-heard case today that equity valuations aren’t so high, given very low long-term rates.
Predictive…or Simply Descriptive?
The real question isn’t whether these characteristics we’ve discussed describe market corrections but whether they can predict them. Should we make investment decisions based solely on extremes of outperformance, flattening yield curves, high valuations or expected earnings declines?
In most cases, the answer is no.
These conditions predicted many more market corrections than actually happened (Display). The weak correlation between earnings growth and market performance may be the most surprising: even if we had perfect foresight into earnings growth for the S&P 500 over the next three or five years, it wouldn’t give us much insight into expected returns. This, along with other analysis we’ve done, leads to what may be a surprising bottom line: earnings haven’t dictated the equity market’s path.
Turning back to the current environment, we can speculate about a negative market surprise due to declines in 2015 earnings and profit margins, but we haven’t seen the traditional sources of cyclical excesses that have been precursors—overly optimistic hiring and capital spending as well as indiscriminate merger-and-acquisition and initial-public-offering activity. We think these are coming—just not yet. Also, there are no signs of deteriorating earnings revisions, and fundamentals are stable or improving in most regions besides Europe.
A Challenge: The Positioning Decision
We don’t expect a major correction until the yield curve flattens further—or when we see more of a buildup in corporate excesses. But a more modest correction of 5%–10% is certainly possible, given the change in sentiment and the midcycle change in the nature of growth.
Historically, these market inflections have seen the most crowded trades underperform: US tech stocks in 2000–2001 are a good example. In the post-2008 environment, investor flows into emerging-market equities offer a more recent example of crowding. Even more recently, the crowded long trade in the New Zealand dollar underperformed starting in mid-July 2014, and worsened because of bearish comments and intervention by the Reserve Bank of New Zealand on July 24.
It’s understandable to look for insulation against crowded trades that could be hurt by changing sentiment, but all-out de-risking may not be preferable to investors. An attractive alternative could be selectively reducing exposure or even hedging the most crowded trades using put options. These areas might include US and Japanese equities; consumer discretionary, financials and healthcare stocks; and emerging markets and some segments of high yield. Investors might also consider continuing to diversify their equity beta exposure.
The views expressed herein do not constitute research, investment advice or trade recommendations and do not necessarily represent the views of all AllianceBernstein portfolio-management teams.
Vadim Zlotnikov is Chief Market Strategist and Co-Head of Multi-Asset Solutions at AllianceBernstein (NYSE: AB).
Copyright © AllianceBernstein


