


By Paul Kornfeld, National Manger of SIACharts.com, Business Development
Creating an ideal mutual fund strategy for your clients is a not an easy task. With over 20,000 mutual funds out there to choose from, it is often overwhelming and daunting to create different mutual fund strategies for your client base. With over 81,000 MFDA advisors (based on the MFDA 2013 statistics) and over 26,000 IIROC licensed advisors in the industry, the competition is also tough to separate yourself from other advisors. As of the end of 2013, mutual funds AUM in Canada were around $1 trillion. Part of separating yourself in the industry from the competition is having a competitive advantage.
Competitive Advantage
This competitive advantage could be that you offer tax efficiency, insurance, financial planning, investment team, industry experience, fee-based discretionary platform, etc. But many advisors offer these same services and all advisors are doing relatively the same due diligence for their clients. Unlike performance measures like ROE or ROA, a competitive advantage cannot always be boiled down to a formula or a ratio and gaining a sustainable competitive advantage is not as simple as just being different. Warren Buffett stated in 1999 that “The key to investing is not assessing how much an industry is going to affect society, or how much it will grow, but rather determining the competitive advantage of any given company and, above all, the durability of that advantage.” Just like the companies you are analyzing are looking to create powerful competitive advantages to grow their company like Coca Cola’s global brand name recognition, you too need to develop a competitive advantage to compete in this business.
An area that a lot of advisors struggle with to provide a competitive advantage is in their investment strategies and performance. Part of this struggle is again the overwhelming possibilities to invest in, contradicting investment information in the media, challenging cyclical markets, invested in too many funds to keep track of, fear of failure, etc. Advisors are realizing that they need help to make these important investment decisions for their clients from risk management, asset allocation, and investment selection. The expanding universe of funds and alternative opportunities, cost of hiring research staff, and just not enough time in the day has seen a trend in the USA where many investment advisors are turning to Registered Investment Advisors (RIAs) to outsource their investment decisions. This is what many Canadian advisors through the purchase of mutual funds are doing as well by trusting in certain mutual fund companies, portfolio managers, or investment strategies that they think give clients the best long-term outlook . The reality is that the industry is changing where competition is increasing, clients are looking for more honest relationships and fee structures (hence the implementation of the CRM2 where firms have to provide pre-trade disclosure charges, fees, and compensation), and technology is changing rapidly.
The importance of technology is playing a new critical role in the industry as more information through the advancement of technology is available to advisors, their clients, and individual investors than ever before. Advisors have to answer to their clients more for their performance and fees since information is much more readily available to non-licensed investors than ever before that lead them to think they can now invest themselves without the help of a licensed advisor. Although technology may be causing problems in some client areas, it also is helping with efficiency and getting powerful information to advisors faster than ever before. Using your firm’s research or third-party investment tools has taken the thousands of investmentsoptions that are available and given advisors powerful tools to help make investment decisions more efficiently and powerfully than ever before. One of these tools that is only available to licensed investment professionals is the only website in Canada that ranks Canadian Mutual Funds according to Relative Strength. SIAFunds is designed to be a powerful resource to help the MFDA (and IIROC) advisor have a competitive advantage to efficiently and powerfully build outperforming unbiased strategies that can help streamline your model strategies, save you time that you were spending on research, and grow your book of business. Let’s take a look at how hundreds of advisors across Canada are already utilizing this competitive advantage.
How to Create a Simple Canadian Mutual Fund Strategy that Outperforms?
Too many advisors in the industry hold too many different mutual funds for their clients in their accounts. This could be a result of a client transferring in new funds that you are unfamiliar with and holding onto them because you didn’t want to trade them right away and have the client charged a bunch of early redemption fees or simply a result of growing your client base and thus having many different mutual funds and models for each client. The most successful advisors we work with are first streamlining their business and investment list from 300 for example down to a manageable 50 to 100 investments to monitor and recommend to their clients. This could start with narrowing down the number of mutual fund companies you work with to 3 to 5 main companies, eliminating duplicate mutual funds that follow similar prospectuses, or selling off higher risk investments according to their low relative strength rankings.
Step 1: Narrow down your list of Mutual Fund companies you want to build strategies with.
Once you have narrowed down your list of companies or investments you want to work with, you then need to know what kind of equity market we are currently in, how to designate your asset allocation according to the risk profile of the clients, and where the strength is in the different Mutual Fund Sectors. SIAFunds helps you answer some of these key questions with their key risk management tool called the SIA Equity Action Call, which lets you know when the risk is too great to be in equity based mutual funds, the SIA Asset Allocation Rankings, which let you know where the lowest risk asset classes currently rank on a 6 to 18 month go forward outlook, and the SIA Canadian Mutual Fund Sector rankings (see below), which show you in more detail the relative strength of all the different CIFSC mutual fund sectors to help you align with the strength in the market.
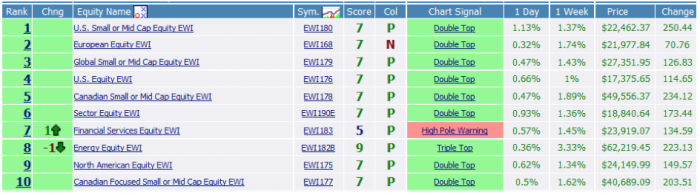
Step 2: Use a top-down approach to know where the strength is between Asset Classes and Mutual Fund Sectors to determine your risk management and Model breakdown.
Using this information of where the lowest risk is found in the asset classes and sectors, you can now go into the mutual fund reports by company that you selected in Step 1 or combine them all together to get an unbiased viewpoint of which mutual funds to invest in that provide you the best opportunity going forward. Using SIA’s Relative Strength rankings can be very simple to track those important mutual funds you invest in for your clients and gain a lot of insight into a complicated marketplace. Don’t just sell your clients a balanced mutual fund anymore that might not be the best investment for that client or the mutual fund giving you the biggest kickback. Start making the best decisions you can for your clients and see the positive referrals and growth of your business take off like never before.
Step 3: Use your selected Mutual Fund Company reports or Combined Mutual Fund Report to find the best mutual funds to invest in for your clients.
Although SIAFunds is more concerned with our advisors understanding the process behind what we do, we also know that advisors are concerned with the bottom line. Below is a list of the returns for the top 5 fund companies on a 1-year, 3-year, and 5-year annualized basis (ranked by their 5-year returns). The data was obtained using either the top 5 mutual funds for companies with25 or more funds in the report or using the SIA Favored zone for companies with less than 25 funds. A buy and hold strategy was used with a quarterly reallocation as necessary.
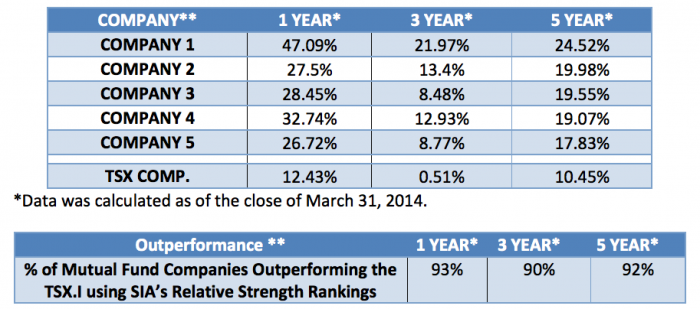
*Data was calculated as of the close of March 31, 2014. Numbers above reflect the outperformance as compared to the TSX Composite Index benchmark (TSX.I) over these time periods using the same buy and hold testing and quarterly reallocation as stated above. Note: These numbers are meant for example purposes and do not represent actual traded strategies or performance and do not guarantee future results.
As we are an independent third party, we are not showing which fund companies achieved what results. This is not being done as an inconvenience to you, but rather so that it does not appear that we may be favoring one company over another.We are not wholesalers for any of these mutual fund companies, but instead want to provide you with the best information possible so that you too can see 1,090 basis points on average of outperformance over 40 of Canada’s largest mutual fund companies over the past year. What is important to understand is that the Relative Strength process has been able to successfully minimize risk while maximizing the potential for outperformance, as seen above with 92% of the companies outperforming the TSX Composite on a 5-year annualized basis using the strategy explained above.
Step 4: Monitor and market your strategy. Use your competitive advantage to grow your book of business.
What are you waiting for? Take advantage now of an investment tool designed just for you to make your life easier and to help you grow your assets. Check out a free one-week trial at www.SIAFunds.com now.
******
**SIAFunds.com specifically represents that it does not give investment advice or advocate the purchase or sale of any security or investment. None of the information contained in this website or document constitutes an offer to sell or the solicitation of an offer to buy any security or other investment or an offer to provide investment services of any kind. Neither SIAFunds.com (FundCharts Inc.) nor its third party content providers shall be liable for any errors, inaccuracies or delays in content, or for any actions taken in reliance thereon. Back tested performance is hypothetical (it does not reflect trading in actual accounts) and is provided for informational purposes to indicate historical performance had the SIA Mutual Fund reports been available over the relevant period. Past performance does not guarantee future results. Investment returns and principal value will fluctuate, so that investors’ shares, when sold, may be worth more or less than their original cost. Investing in any investment process, does not guarantee that an investor will make money, avoid losing capital, or indicate that the investment is risk-free. There are no absolute guarantees in investing so when reviewing any back tested performance information on the SIAFunds.com website, email content, or other materials, ensure that you do not use to make investment decisions.