by Guy Lerner, The Technical Take
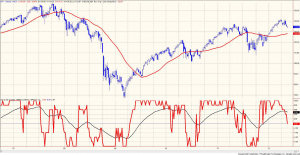
Figure 1 shows a weekly chart of the S&P Depository Receipts (symbol: SPY). The indicator in the lower panel is constructed from the 9 SP500 sector ETF’s (data hidden). The indicator assesses the relative strength of each sector utilizing a 13 week look back period. As you can see, the indicator is rolling over.
Figure 1. SPY/ Relative Strength/ weekly

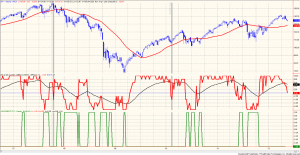
Now look at figure 2 which is the same graph, but this time I have added an analogue of our “dumb money” indicator in the lower panel. (When the value is “up”, that means there are too many bears, which is a bull signal.) Going back to 2000, the breakdown in the indicator is associated increasing number of bears. The gray vertical lines indicate those two times where the breakdown in market internals failed to bring about the bears. As market internals (i.e., sector ETF’s) are breaking down, it is my expectation that investors will turn bearish. Shortly after that, it will be time to buy.
Figure 2. SPY/ Relative Strength/ Investor Sentiment/weekly

Taking another perspective, I still contend that it is too early to “BTFD”. Looking at this data, we still need to wait for investors to turn bearish.
Copyright © The Technical Take


