February 2, 2012
As the saying goes, “every dog has its day” and global markets appear to have followed this historical trend lately as last year’s dogs became the darlings of January. Notably, small-caps, copper and junior resources stocks have climbed recently, indicating that momentum has shifted.
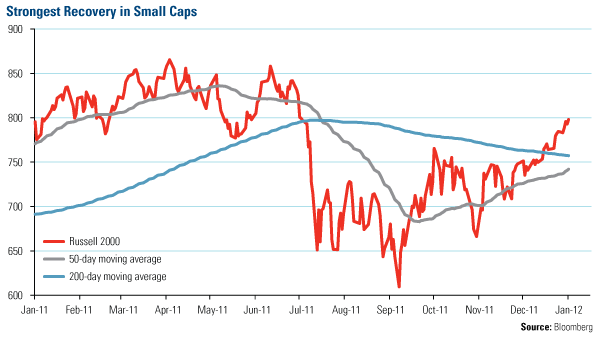
Take a look at the small-cap Russell 2000 Index which was decimated in July, days before the 50-day moving average fell below the 200-day moving average. I discussed how traders buy or sell off of these short-term and long-term moving averages when I wrote about the “golden cross” a few weeks ago.
This year is off to such a great start that if small caps continue this momentum, we should see the 50-day moving average for the Russell 2000 cross above the 200-day soon. This would likely drive new investor interest in this space.

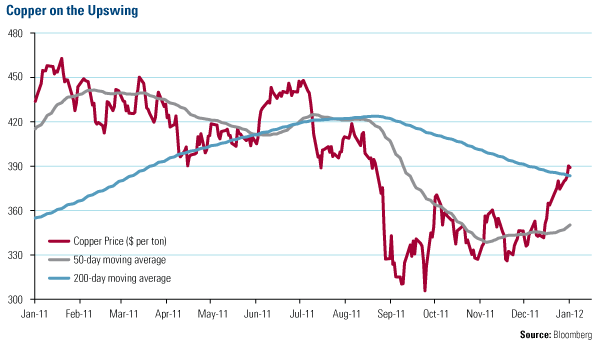
Copper also took a few major blows last year, first in July and then in September as a result of the carry trade. To gain a yield advantage, large investors use the carry trade to advantageously borrow in yen (because interest rates are low), convert it to a stronger currency and invest in higher-return, higher-risk assets, specifically commodities and dividend-paying emerging markets stocks.
When the yen began to strengthen against the dollar in August and again in October, Japan intervened to weaken its currency. The yen quickly reversed, causing the higher-return assets to decline.

As our commodities table shows, copper was among the worst-performing commodities that we track, declining more than 20 percent last year. This lagging performance came despite supply/demand fundamentals that argued for higher prices.
We expected copper to eventually revert to its long-term mean and it only took a few positive drivers to drive prices higher. One of these drivers was the JP Morgan Global Manufacturing Purchasing Managers’ Index crossing above the three-month moving average, which occurred at the end of December. Ninety percent of the time, when this has happened, copper was positive over the next three months, with a median return of 10 percent over the following three months.
Additional drivers that have provided the impetus for higher prices include a significant increase in money supply, interest rate cuts around the world, and central banks dropping their reserve rate for banks.
Look for this trend to continue.
Also Read:
- Anticipating the Golden Cross
- Junior Resources Companies Set to Outperform?
- Have Winds Shifted to Provide Relief to Investors?
- The Periodic Table of Commodity Returns
All opinions expressed and data provided are subject to change without notice. Some of these opinions may not be appropriate to every investor.
The Russell 2000 Index® is a U.S. equity index measuring the performance of the 2,000 smallest companies in the Russell 3000®, a widely recognized small-cap index. The Purchasing Manager’s Index is an indicator of the economic health of the manufacturing sector. The PMI index is based on five major indicators: new orders, inventory levels, production, supplier deliveries and the employment environment.


